
Canada Search Demand Index 2026: Which Cities Search Most for Local Services
The Canada Search Demand Index measures how often people in 20 of Canada’s largest cities search Google for 62 everyday local services, from plumbers and dentists to lawyers, mechanics and florists, and compares that demand per resident. This first edition, published in November 2026, covers searches made over the most recent 12 months and ranks 19 cities. It is meant for business owners deciding where to advertise, journalists covering local economies, and anyone curious about what Canadians look for when they need help close to home.
Key findings
- Vancouver leads the index at 198, almost twice the median city. Toronto is second at 145, followed by Vaughan and Calgary (121 each) and London, Ontario (120).
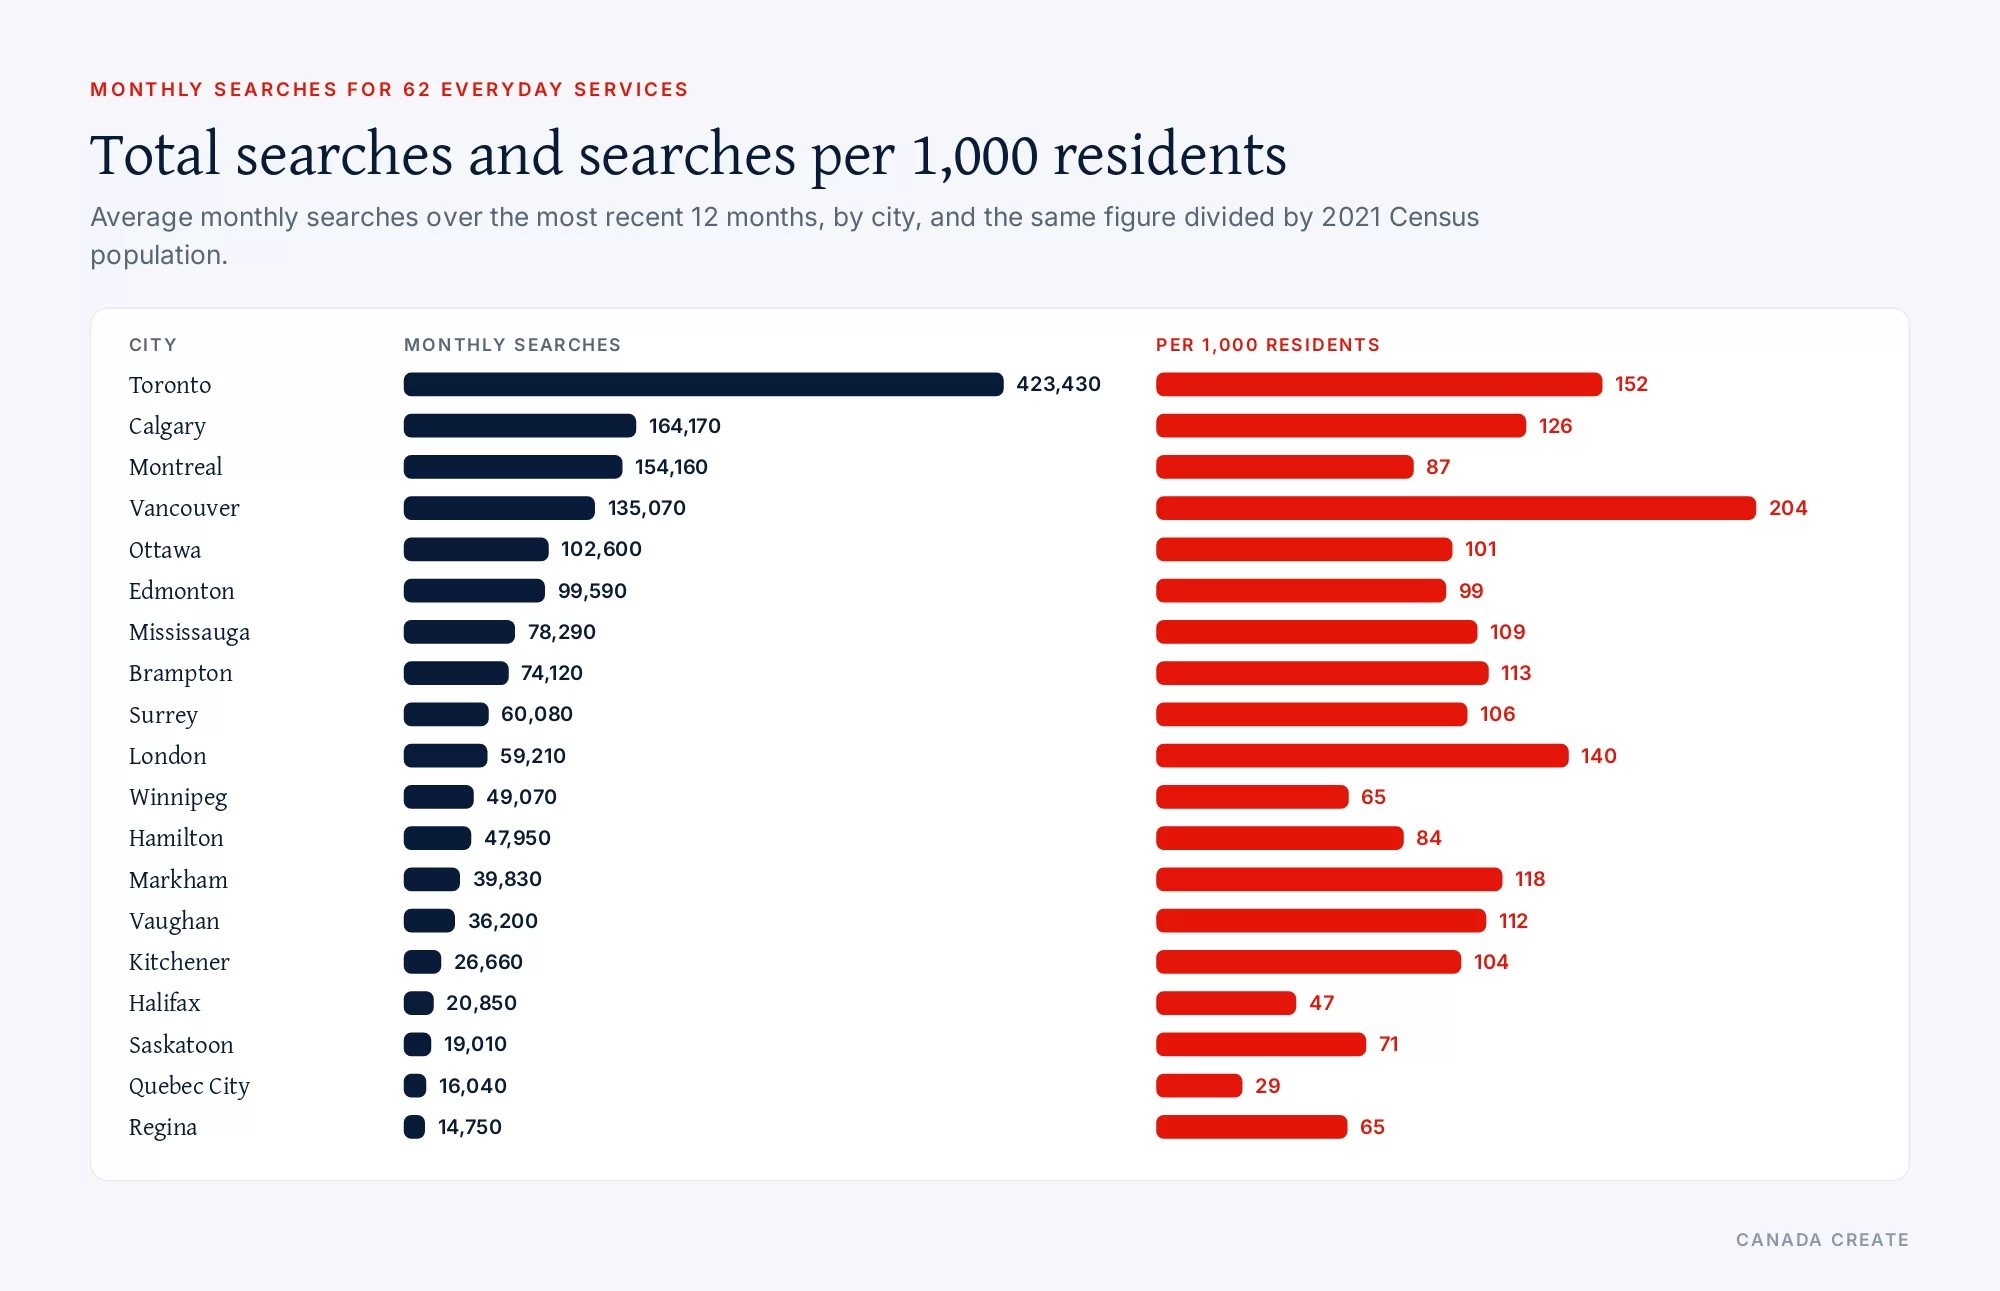
- Toronto accounts for 26 per cent of all searches in the 19 ranked cities (423,430 a month) while holding 19 per cent of their combined population.
- The five largest GTA cities (Toronto, Mississauga, Brampton, Markham and Vaughan) produce 40 per cent of the searches with 33 per cent of the population.
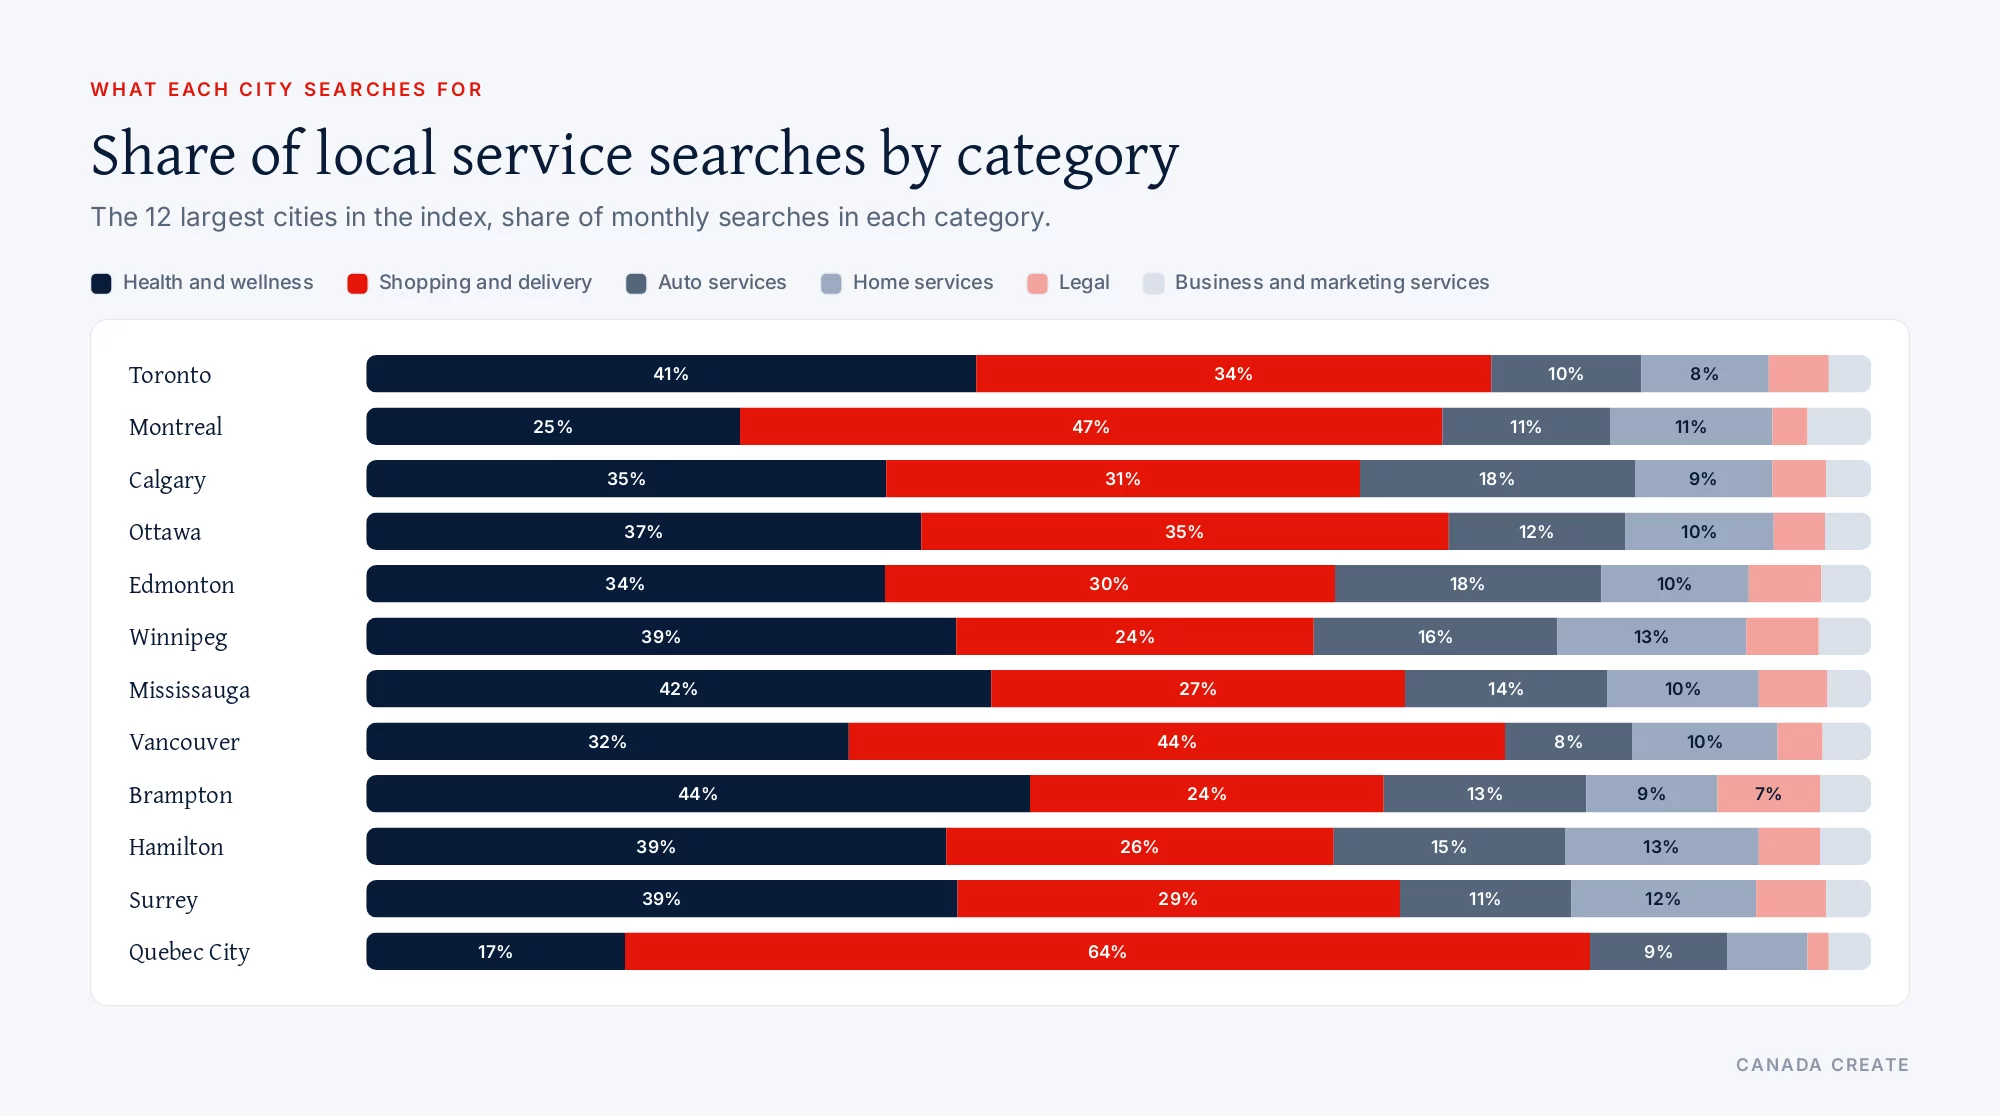
- Health and wellness is the largest category, at 36 per cent of all searches, just ahead of shopping and delivery at 34 per cent. Legal searches are 4 per cent and business and marketing services 3 per cent.
- “Pharmacy near me” is the most searched term in 15 of the 20 cities. “Walk in clinic” tops the list in Winnipeg, Regina, Markham and Vaughan.
- Six “near me” searches account for 35 per cent of all searches in the basket, led by “pharmacy near me” and “dentist near me”.
- Brampton has the highest legal search demand per resident (legal index 205), ahead of Toronto (165) and Vaughan (153).
- Prairie cities search hardest for heating and cooling repair: Regina, Calgary and Saskatoon lead furnace repair searches per resident, and Saskatoon, Winnipeg and Regina lead air conditioner repair.
The 2026 index by city
An index score of 100 means a city searches for these services at the same rate per resident as the median city in the ranking. A score of 150 means 50 per cent more demand per resident; a score of 75 means a quarter less.
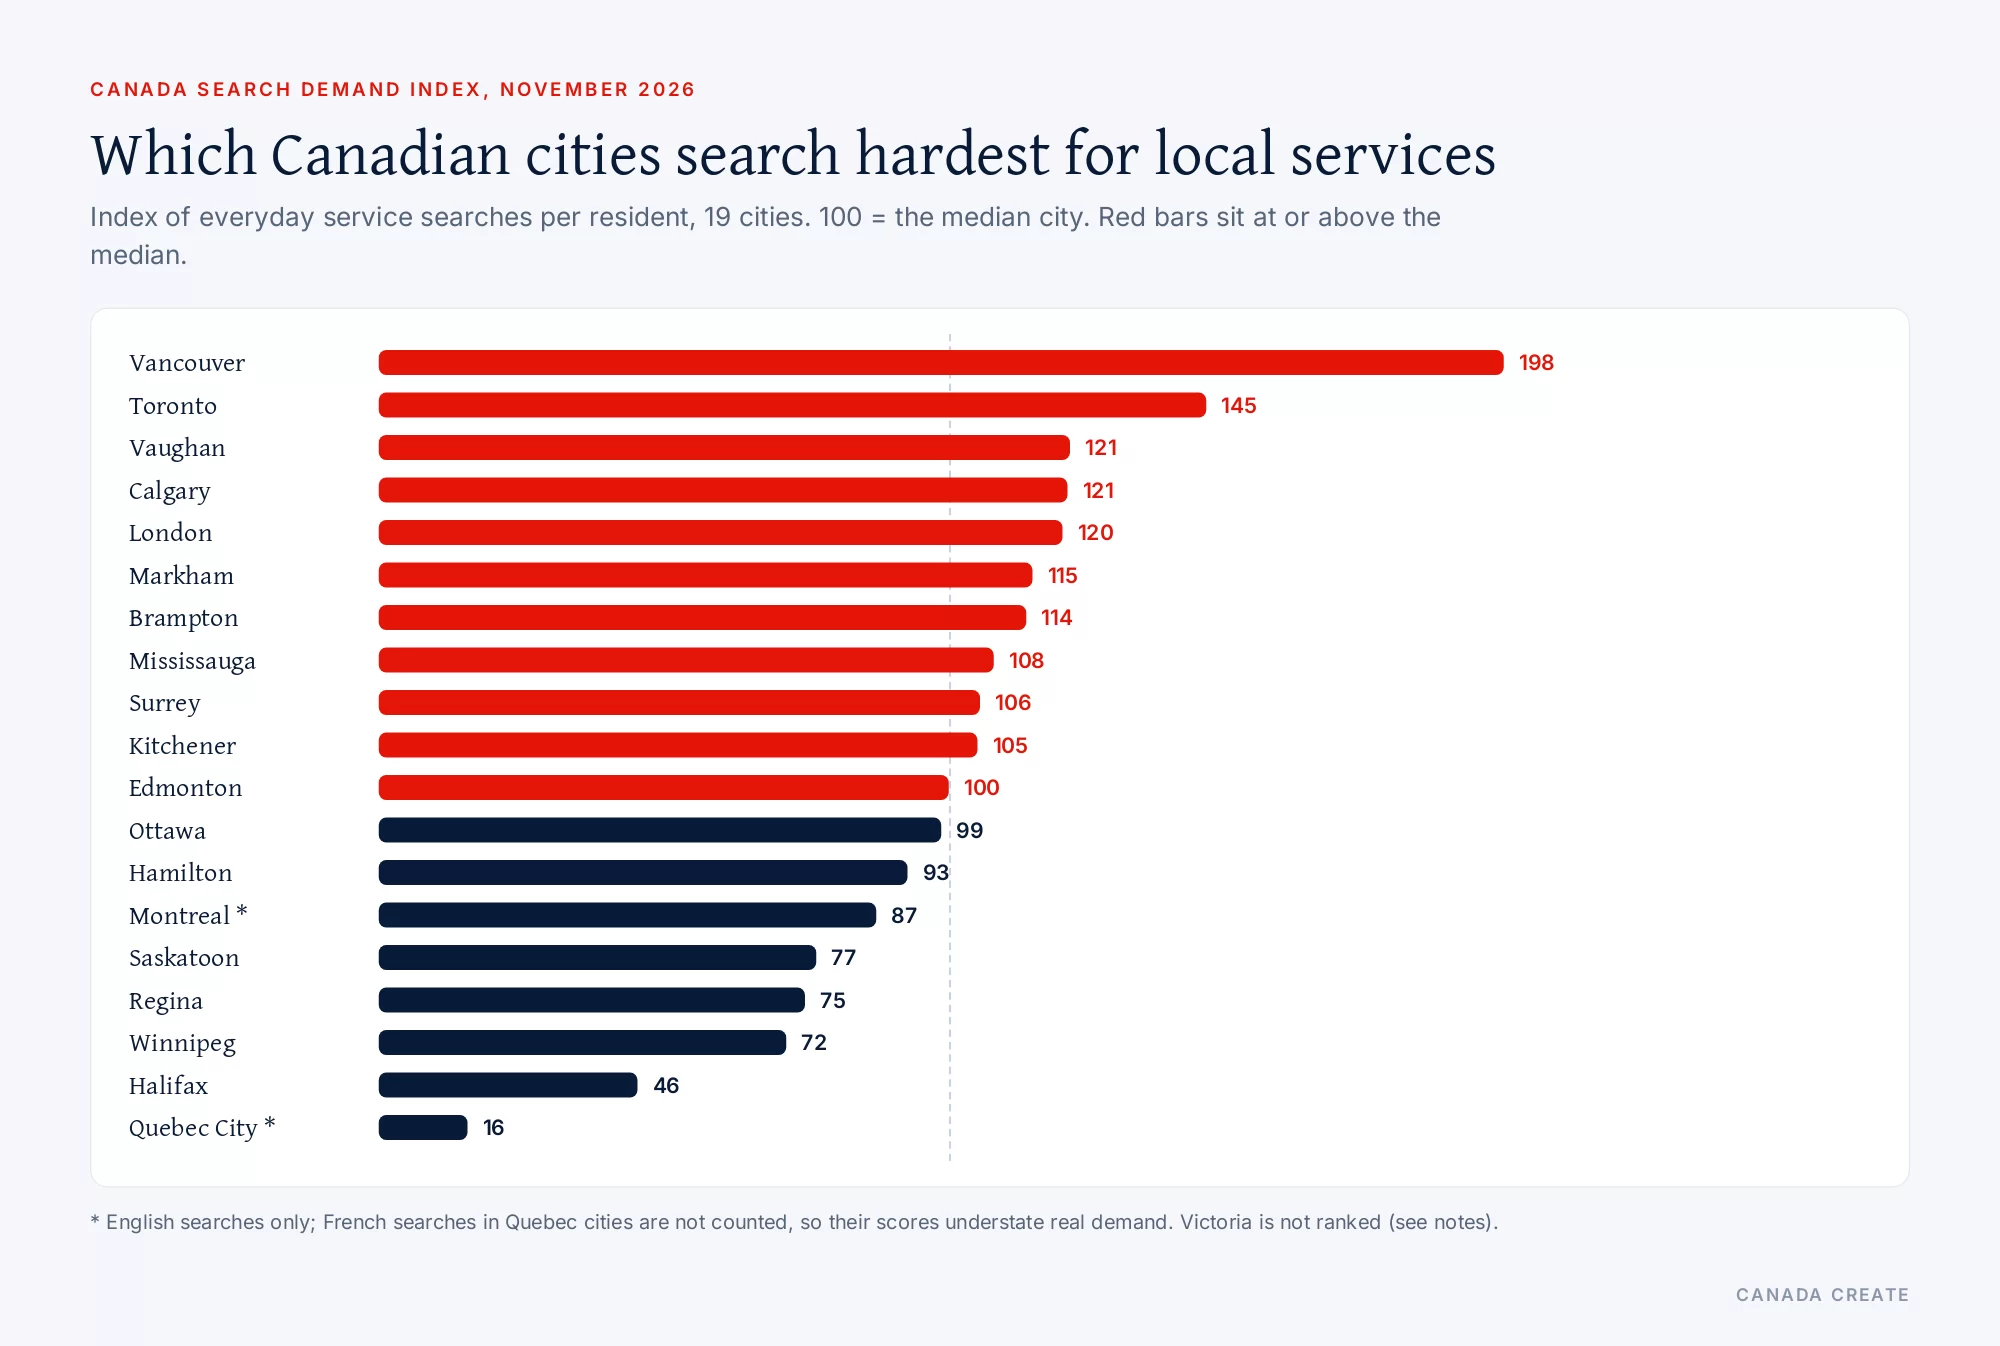
| City | Demand Index | Searches per 1,000 residents | Average monthly searches | Population (2021 Census) | Most searched term |
|---|---|---|---|---|---|
| 1. Vancouver | 198 | 204 | 135,070 | 662,248 | pharmacy near me |
| 2. Toronto | 145 | 152 | 423,430 | 2,794,356 | pharmacy near me |
| 3. Vaughan | 121 | 112 | 36,200 | 323,103 | walk in clinic |
| 4. Calgary | 121 | 126 | 164,170 | 1,306,784 | pharmacy near me |
| 5. London | 120 | 140 | 59,210 | 422,324 | towing |
| 6. Markham | 115 | 118 | 39,830 | 338,503 | walk in clinic |
| 7. Brampton | 114 | 113 | 74,120 | 656,480 | pharmacy near me |
| 8. Mississauga | 108 | 109 | 78,290 | 717,961 | pharmacy near me |
| 9. Surrey | 106 | 106 | 60,080 | 568,322 | pharmacy near me |
| 10. Kitchener | 105 | 104 | 26,660 | 256,885 | pharmacy near me |
| 11. Edmonton | 100 | 99 | 99,590 | 1,010,899 | pharmacy near me |
| 12. Ottawa | 99 | 101 | 102,600 | 1,017,449 | pharmacy near me |
| 13. Hamilton | 93 | 84 | 47,950 | 569,353 | pharmacy near me |
| 14. Montreal * | 87 | 87 | 154,160 | 1,762,949 | pharmacy near me |
| 15. Saskatoon | 77 | 71 | 19,010 | 266,141 | pharmacy near me |
| 16. Regina | 75 | 65 | 14,750 | 226,404 | walk in clinic |
| 17. Winnipeg | 72 | 65 | 49,070 | 749,607 | walk in clinic |
| 18. Halifax | 46 | 47 | 20,850 | 439,819 | pharmacy near me |
| 19. Quebec City * | 16 | 29 | 16,040 | 549,459 | pharmacy near me |
| Victoria ** (not ranked) | 272 | 354 | 32,510 | 91,867 | pharmacy near me |
We manage Google Business Profiles, citations and reviews so local customers find and call you.
* English searches only; French searches in Quebec cities are not counted, so Montreal and Quebec City understate real demand. ** Victoria is shown but not ranked: the City of Victoria had 91,867 residents in 2021, less than a quarter of the 397,237 people in the Victoria metropolitan area, so searches from the wider capital region inflate its per-resident figure.
Total demand and demand per resident
Size and intensity tell different stories. Toronto produces more searches for these services than Calgary and Montreal combined, but Vancouver residents search more often per person. Mid-sized Ontario cities such as London, Kitchener and Vaughan sit above the median, while Winnipeg, Regina and Saskatoon sit below it despite strong demand for heating and cooling repair.
Which cities lead each category
Each category has its own index, built the same way as the overall score. The table shows the three cities with the highest demand per resident in each one (100 = the median city for that category).
| Category | Highest per resident | Second | Third |
|---|---|---|---|
| Home services | Vancouver (186) | London (127) | Toronto (127) |
| Health and wellness | Vancouver (189) | Toronto (154) | Calgary (123) |
| Legal | Brampton (205) | Toronto (165) | Vaughan (153) |
| Business and marketing services | Vancouver (256) | Montreal (154) | Toronto (143) |
| Auto services | London (222) | Calgary (135) | Vancouver (132) |
| Shopping and delivery | Vancouver (338) | Toronto (215) | Calgary (129) |
Health and wellness
Health searches are the backbone of local demand. “Dentist near me”, “walk in clinic”, “physiotherapy near me” and “optometrist” appear in the top ten searches of almost every city. Brampton (44 per cent), Mississauga and Markham (42 per cent each), and Vaughan and Toronto (41 per cent each) devote the largest shares of their service searches to health. “Dentist near me” ranks in the top five searches in all 20 cities.
Home services
Vancouver leads home services per resident, with London and Toronto next. The Prairies stand out for climate-driven searches: furnace repair and air conditioner repair draw far more searches per resident in Regina, Saskatoon and Winnipeg than in coastal cities.
Legal
Brampton’s legal index of 205 is the highest legal score in the index. It ranks first per resident for “lawyer near me”, “immigration lawyer” and “criminal lawyer”. Toronto has the largest absolute legal demand, with 1,900 monthly searches for “family lawyer” and 1,600 for “divorce lawyer”.
Business and marketing services
Searches such as “accountant”, “web design”, “seo” and “marketing agency” are a small share of the total but carry high commercial value. Vancouver leads per resident, followed by Montreal (on English searches alone) and Toronto, which has the largest absolute volume, including 1,600 monthly searches for “seo”.
Auto services
London, Ontario has the highest auto score, driven by unusually strong demand for “towing” (about 14,800 searches a month, a level that held through the year). Calgary and Vancouver follow. “Car wash” is the largest auto search in 19 of the 20 cities.
Shopping and delivery
Vancouver and Toronto lead shopping and delivery per resident. “Pharmacy near me” alone accounts for about one in five searches in the whole basket, and “bakery” ranks in the top three searches in Montreal, Vancouver, Ottawa and Markham.
What the index means for local businesses
Search demand is a direct measure of people actively looking for a service. A few practical points follow from the 2026 figures.
- Demand per resident varies more than people expect. A business expanding from Winnipeg to Calgary, or from Hamilton to Vaughan, should expect noticeably more search demand per resident, which affects how much visibility is worth paying for.
- “Near me” searches reward a complete Google Business Profile. When six “near me” searches make up more than a third of all demand in the basket, the map results and the business profile do much of the work. See local SEO in Toronto for what that involves.
- The GTA is not one market. Brampton’s legal demand, Markham’s and Vaughan’s health demand and Toronto’s sheer volume call for different priorities, even for firms a short drive apart.
- Quebec needs French. English-only figures understate Montreal and Quebec City, so businesses serving Quebec should research and publish in French.
- Seasonal services follow the climate. Heating and cooling businesses on the Prairies face sharper demand peaks, so content and ads should be ready before the season turns.
For businesses that want to turn this demand into calls and bookings, Canada Create’s SEO and Google Ads pages explain the services, and its city pages, such as SEO in Vancouver and SEO in Calgary, cover local markets.
How the index is calculated
The index uses Google’s average monthly search volumes for the most recent 12 months available in early November 2026 (October 2025 to September 2026), measured separately for searchers located in each of the 20 cities. The basket is a fixed list of 64 everyday local service searches written in English, grouped into six categories. Two searches (“chiropractor” and “personal injury lawyer”) returned no figure in at least one city and were removed from every city, leaving 62.
For each search, the city’s monthly volume is divided by its population from Statistics Canada’s 2021 Census population counts to give searches per resident. Each city’s figure is then compared with the median of the 19 ranked cities for that search, and the comparisons are averaged (a geometric mean) so that one very popular search such as “pharmacy near me” cannot dominate the result. The median city scores 100. Category scores are built the same way from the searches in each category.
The searches in the basket are:
- Home services: plumber, plumber near me, electrician, electrician near me, roofing, furnace repair, air conditioner repair, landscaping, cleaning services, moving company, pest control, locksmith, handyman, painters, general contractor.
- Health and wellness: dentist, dentist near me, emergency dentist, physiotherapy, massage therapy, optometrist, walk in clinic, dermatologist, orthodontist, physiotherapy near me.
- Legal: lawyer, lawyer near me, family lawyer, divorce lawyer, immigration lawyer, real estate lawyer, criminal lawyer, employment lawyer, notary public.
- Business and marketing services: accountant, bookkeeping services, tax preparation, it support, web design, seo, digital marketing agency, marketing agency, graphic designer, printing services, insurance broker, mortgage broker.
- Auto services: mechanic, auto repair, car detailing, tire shop, towing, oil change, auto body shop, car wash.
- Shopping and delivery: flower delivery, furniture store, grocery delivery, pharmacy near me, gift shop, bakery, florist, pet store.
Notes and limits
- Search volumes are rounded averages and describe searches on Google only.
- Google’s city areas do not match census boundaries exactly. Core cities that serve a wider region, such as Vancouver and Victoria, can score higher per resident; large amalgamated municipalities such as Halifax Regional Municipality, which includes rural areas, can score lower.
- Population figures are 2021 Census counts, the most recent census; cities that have grown quickly since then, such as Brampton and Calgary, may score slightly high.
- The basket is in English, so French-language demand in Quebec is not counted.
- Search demand measures interest, not sales. A city with high demand may also have more competition for each search.
Next edition
The index is planned as a quarterly series, with the next edition expected in the first quarter of 2027, using the same basket so cities can be compared over time. Journalists and researchers are welcome to quote the figures with a link to this page.
Frequently asked questions
What is the Canada Search Demand Index?
It is a quarterly index of how often people in 20 large Canadian cities search Google for 62 everyday local services, such as plumbers, dentists, lawyers, mechanics and florists, measured per resident. A score of 100 is the median city, so a city at 150 searches for these services 50 per cent more per person.
Which Canadian city has the highest search demand for local services?
In the November 2026 edition, Vancouver leads with an index of 198, followed by Toronto at 145, Vaughan and Calgary at 121 each, and London, Ontario at 120. Victoria scores higher still but is not ranked, because the city boundary holds less than a quarter of its metropolitan population.
How much does Toronto search for local services?
Toronto produces about 423,000 searches a month for the 62 services in the basket, which is 26 per cent of all searches in the 19 ranked cities while the city holds 19 per cent of their combined population.
What do Canadians search for most when they need a local service?
"Pharmacy near me" is the most searched term in 15 of the 20 cities, and "walk in clinic" tops the list in Winnipeg, Regina, Markham and Vaughan. Health and wellness is the largest category at 36 per cent of all searches.
How important are near me searches in Canada?
Six "near me" searches in the basket account for 35 per cent of all searches, led by "pharmacy near me" and "dentist near me". For local businesses this makes the Google Business Profile and map results a central part of being found. See local SEO in Toronto.
Which city searches most for lawyers?
Brampton has the highest legal search demand per resident, with a legal index of 205, and ranks first per resident for "lawyer near me", "immigration lawyer" and "criminal lawyer". Toronto has the largest absolute legal demand.
Why are Montreal and Quebec City ranked low?
The basket is in English, so French searches are not counted. Montreal and Quebec City therefore understate real demand, and businesses serving Quebec should research French search terms separately.
How is the index calculated?
For each search, a city's average monthly Google searches over the most recent 12 months are divided by its 2021 Census population. Each result is compared with the median city and the comparisons are averaged with a geometric mean, so a single very popular search cannot dominate. The median city scores 100.
How often is the index updated?
The index is planned as a quarterly series using the same basket of searches, with the next edition expected in the first quarter of 2027.
Can journalists use these figures?
Yes. Journalists and researchers are welcome to quote the index and its charts with a link to this page as the reference.
What does the index mean for a local business?
It shows where people are actively looking for a service and how intense that demand is per resident. Businesses can use it to compare markets before expanding, to plan ad budgets by city, and to see when a category depends on map results. See SEO for how search visibility is built.