
Conversion Rate Optimization: What It Actually Is and What It Actually Does

Conversion rate optimization, or CRO, is the process of investigating why suitable visitors do not complete a useful action, making a focused improvement and measuring what changes. The action might be a purchase, a qualified enquiry or a booking. More clicks alone are not the objective if they do not lead to a better customer or business outcome.

This guide explains the calculation, the research, the test plan and the limits of the evidence. It also shows when to fix a clear fault without an experiment, how to work with low traffic and how to judge a result that looks impressive on a dashboard. The numerical scenarios are hypothetical examples with stated assumptions, not past client cases or promised improvements.
A More Useful Definition
CRO starts with a specific question about a customer task. Can a buyer understand whether the offer fits? Can a mobile visitor call? Can someone complete a form without unnecessary effort? A useful optimization connects an observed problem to a proposed change and a measurable outcome.
A full process has several parts: define the conversion, verify the measurement, investigate friction, prioritize a hypothesis, make a controlled change where appropriate and assess the result. The conclusion may be that the change helped, hurt or did not produce enough evidence to decide. An honest inconclusive result is more useful than declaring a winner because one version had a slightly larger percentage.
The word “optimization” does not mean extracting an action from every visitor. Some people are researching, looking for support or checking whether the service is suitable. Clear pricing, eligibility and limitations may reduce unsuitable enquiries while improving qualified outcomes. Removing that information to raise the form-completion rate would solve the wrong problem.
How to Calculate Conversion Rate
Session conversion rate = eligible sessions with at least one qualifying conversion ÷ all eligible sessions × 100.
The measurement unit might be users, sessions or another defined opportunity. Choose it before comparing results and keep it consistent. For a user-based rate, count users who converted and divide by eligible users. Counting all enquiry events per session is a different measure: one person can visit more than once or submit repeatedly. Google Analytics distinguishes session and user key-event rates from event counts; keep the same distinction in your own reporting.
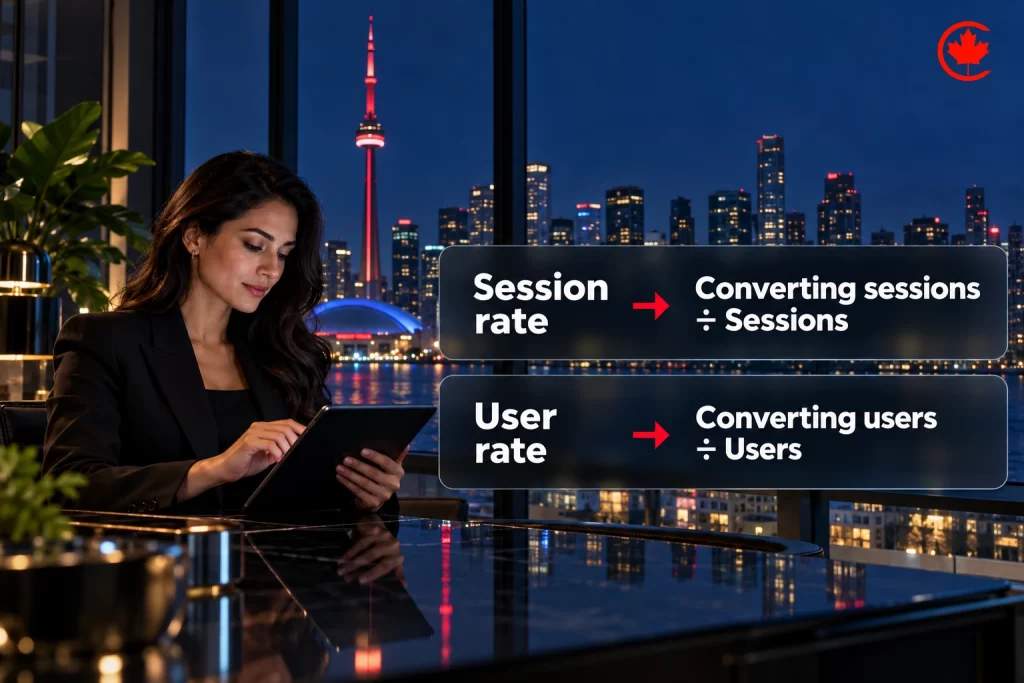
For example, assume 2,000 eligible sessions produced 50 valid enquiries during a defined period, each in a different session and counted once. The session conversion rate is 50 ÷ 2,000 × 100 = 2.5%. If only 30 of those distinct enquiry sessions produced a lead meeting the business’s qualification criteria, the qualified-enquiry rate is 30 ÷ 2,000 × 100 = 1.5%. Both figures can be correct, but they answer different questions.
State what counts. An attempted form submit is different from a successfully received submission. A tap on a phone link is different from an answered call. A booking request is different from an attended appointment. Track intermediate actions when useful, but do not silently rename them completed sales.
CTR and conversion rate answer different questions
Click-through rate, or CTR, measures clicks relative to impressions. A website conversion rate measures a defined action relative to the eligible users or sessions being assessed. An advertising platform may use a different conversion denominator, such as ad interactions, so read the report definition before comparing it with website analytics.
For a hypothetical example, 10,000 ad impressions and 200 clicks produce a 2% CTR. Separately, assume 180 eligible website sessions are recorded and nine of those sessions produce a valid enquiry. The website session conversion rate is 9 ÷ 180 × 100 = 5%. The click and session totals need not be identical, so substituting 200 as the website denominator would answer a different question.
A higher CTR can bring more visitors without improving the proportion who enquire. It can also attract a different audience. Assess the promise made before the click, the landing experience and qualified outcomes together. Do not claim a landing-page improvement because the advertisement received more clicks.
Choose a primary outcome and supporting checks
| Business model | Possible primary outcome | Supporting checks |
|---|---|---|
| Lead-generation service | Qualified enquiries per eligible visitor or session | Duplicate and spam submissions, sales acceptance, close rate and response capacity |
| Online store | Completed orders or net revenue per eligible visitor | Average order value, contribution, cancellations, returns and checkout errors |
| Appointment business | Confirmed bookings or attended appointments | Availability, cancellations, no-shows and booking quality |
| Trial or subscription offer | Eligible trial starts or paid activation, depending on the decision | Activation, retention, support burden and later payment outcomes |
We test pages, forms and offers to turn more visitors into enquiries.
A supporting check can become a guardrail: an outcome that must not worsen unacceptably while the primary metric improves. A shorter form may produce more submissions but fewer suitable leads. A larger discount may increase orders while reducing contribution. Define those trade-offs before seeing the result.
What This Looks Like in Practice
Step 1: Identify Where Visitors Are Actually Dropping Off
Map the route from arrival to the intended outcome. Look for a specific step worth investigating, such as a mobile contact action, a form validation error or a checkout stage. A large drop-off is a starting point, not a diagnosis: some visitors may have found the information they needed or discovered that the offer was not suitable.
Consider a hypothetical Toronto law firm website. Assume its mobile contact page receives visits, but the team has not checked whether its displayed phone number can be tapped or whether calls reach the right person. The first step is to test the interaction and reconcile the analytics with the actual intake process. No result should be claimed from this example because no client measurement is being reported.
Step 2: Form a Specific, Testable Hypothesis
A useful hypothesis follows a simple structure: “Because we observed this problem in this audience, making this change should improve this outcome, without harming this guardrail.” It separates the observation from the explanation you still need to test.
For the hypothetical mobile page, a hypothesis could be: “If eligible mobile visitors cannot easily find a working contact action, placing a clearly labelled call option beside the service explanation may increase successfully connected, relevant enquiries.” The guardrails could include accidental taps, unsuitable calls and usability for people who prefer another contact method.
Do not claim to know that every departing visitor was confused or anxious. Analytics may show an exit; usability research may reveal a difficulty. Neither justifies inventing the visitor’s complete motivation. Write the hypothesis as a possibility supported by the evidence you actually have.
Step 3: Make One Focused Change and Measure It
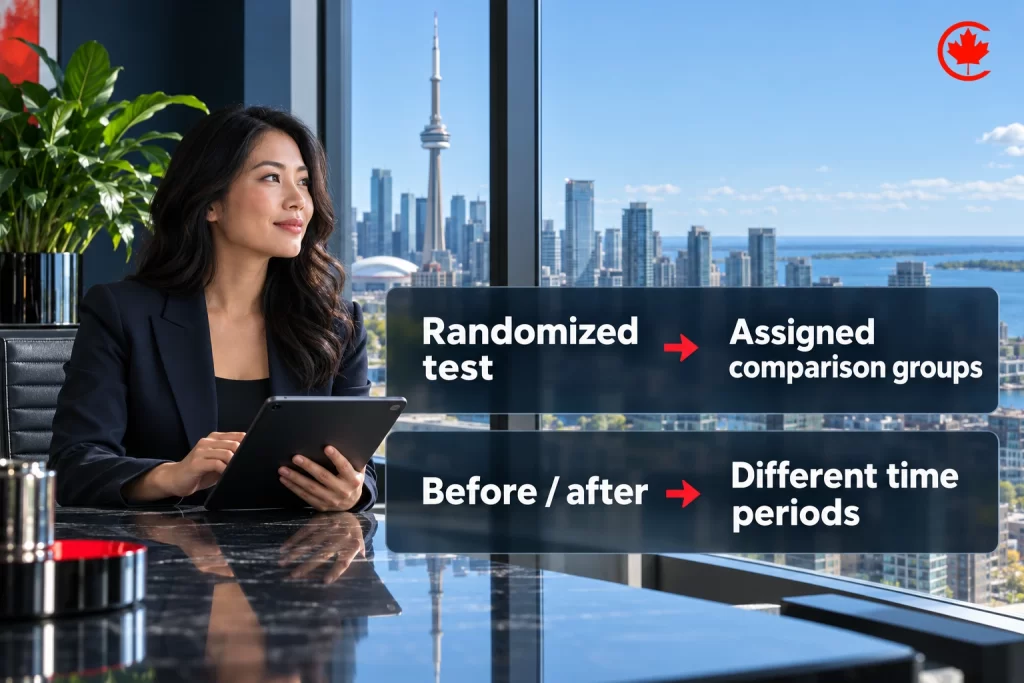
If the number is not a functioning phone link, correct and verify that defect. You do not need to preserve a broken experience merely to create a test. Record the fix and monitor the relevant outcomes, while recognizing that a before-and-after comparison alone cannot isolate its revenue effect.
If the interaction works and the question is which presentation is clearer, an appropriately designed concurrent randomized test may be useful. Compare a defined alternative against the current version for eligible visitors, keep assignment consistent and check that the measurement works in both experiences. The test should have a planned primary outcome, sample-size approach, duration considerations and decision rule. NIST explains random assignment in experimental design; applying it to a website still requires a suitable measurement and assignment plan.
Changing several elements together is not automatically invalid. You can test a bundled experience, but the result concerns the bundle, not proof that one headline or button caused it. If the goal is to understand an individual element, keep the comparison focused enough to answer that question.
Step 4: Act on the Result and Choose the Next Question
Use the outcome to choose the next question, not to build a story of inevitable improvement. If the test is inconclusive, consider whether the effect was smaller than the design could detect, the sample was insufficient or the hypothesis was weak. If a change harms qualified outcomes, revert it safely and record what was learned.
After a successful test, verify the released experience, measurement and downstream outcomes. A gain in initial enquiries is not a complete result if the sales team cannot reach those prospects or the apparent lift came from duplicate events. Keep a change log so later performance reviews can distinguish a page change from an advertising or offer change.
If you need help turning existing records into a focused investigation, book a call with Canada Create. Start with the decision you need to make and the information available, rather than a promised uplift.
Verify the Measurement Before Changing the Page
Bad measurement can make a sound change look ineffective or a broken experience look successful. Test the conversion event from the visitor action through to the destination system. For a form, check whether the submission was received, whether it was counted once and whether required follow-up information arrived.
Review the following before using a baseline:
- Event definition: does the measurement represent an attempted action, a completed action or a later business outcome?
- Duplicate handling: can a refresh, repeated click or repeated visit count the same outcome more than once?
- Eligibility: are staff, test traffic, irrelevant markets or visitors unable to buy included in the denominator?
- Coverage: could consent choices, blocking, device changes or cross-domain journeys leave part of the path unobserved?
- Reconciliation: do analytics totals make sense beside the CRM, booking system or order records?
- Consistency: did tracking, qualification rules or attribution change during the comparison?
Different systems may not agree perfectly because they count different events or use different attribution rules. Investigate meaningful discrepancies and document the remaining limitations. Do not force totals to match by changing definitions after the result is known.
Also separate measurement failure from business failure. If a form reaches the inbox but no event fires, the tracking needs repair. If an event fires but the message never arrives, the customer journey needs repair. Both matter, but they call for different fixes.
Read the Funnel Before Blaming the Landing Page
A funnel describes a sequence, not an explanation of why each person left. Define the steps using events that actually exist and can be measured consistently. For a service business, these might be arrival, contact attempt, successful enquiry, qualification and completed sale. Some customers will call directly or return later, so an incomplete tracked path is not proof that they abandoned the business.
Suppose a hypothetical month contains 1,000 eligible visitors, 100 form starts, 60 received submissions, 30 qualified enquiries and 10 completed sales. Assume the records are linked consistently, each person is counted once and the sales have had time to mature. Those counts suggest several different investigation questions:
- For the 40 starts without a received submission, check errors, unnecessary requirements and whether tracking is complete.
- For the 30 submissions that were not qualified, inspect audience fit, offer clarity, spam and the qualification rule.
- For qualified enquiries that did not become sales, inspect availability, response time, price and stated reasons rather than assuming a page defect.
The overall completed-sale rate would be 10 ÷ 1,000 = 1%. The form-completion rate among starters would be 60 ÷ 100 = 60%. Neither rate can substitute for the other. Improving the form may help, but a bottleneck after qualification could limit the value of more submissions.
Use this breakdown to assign ownership. A website issue, a campaign mismatch and a sales follow-up problem may require different people. The purpose is not to move every problem into the CRO label; it is to find the step where an actionable change can improve the end-to-end experience.
Research the Reason, Not Just the Exit Rate
Quantitative data can show where a pattern occurs. It rarely supplies the full explanation. Combine it with a focused inspection of the page, relevant customer questions, support themes and usability checks. Look for a specific mismatch between what a visitor needs and what the experience makes possible.

Useful research questions include whether the visitor can understand the offer, identify the next step, find important conditions and recover from errors. Watch a representative user attempt the task where practical. Ask what they expected to happen rather than suggesting the answer you want to hear.
Segment carefully. Mobile and desktop experiences may differ, as may branded search, a paid campaign and a returning customer. But repeatedly slicing a small dataset can produce unstable percentages. Use segments to form a grounded question, not to search indefinitely for a subgroup that appears to prove the change worked.
Common Elements to Investigate and Test
| Element | Hypothesis to Test |
|---|---|
| Above-the-fold clarity | Does a specific, benefit-stated headline make the offer clearer? |
| Form length | Can fewer required fields improve completion without reducing lead quality? |
| Call-to-action wording | Does action-specific wording help visitors understand the next step? |
| Trust signals placement | Do relevant reviews and credentials answer questions near the decision point? |
| Mobile-specific friction | Can a mobile-focused layout remove friction for phone users? |
Offer clarity and expectations
A visitor should be able to understand what is offered, who it is for and what happens next. A more specific headline is a hypothesis to test, not a universal winner. Avoid claims, credentials or testimonials that cannot be verified. Clarity about price, suitability and limitations may be more useful than a stronger-sounding promise.
Forms and checkout
Review every field against a real need. Remove avoidable effort where appropriate, but keep information required to deliver the service, qualify the request or meet applicable obligations. Explain unusual requirements and provide useful error messages. Check keyboard use, labels, mobile input types and whether entered information survives a recoverable error.
Calls to action and contact choices
Use wording that matches the actual next step. “Request a quote” should not unexpectedly commit someone to a purchase. Test whether the page supports the visitor’s context: a phone option may be useful during business hours, while a form may be necessary when staff are unavailable. More buttons are not automatically better if the choices compete or confuse.
Performance and technical reliability
Slow or unstable interactions are worth investigating, especially where they interrupt a task. Verify the problem on relevant devices and connections rather than assuming a single lab score explains all behaviour. Fix broken submissions, inaccessible controls and misleading states because they prevent a usable experience; measure the commercial effect separately.
Prioritize Changes by Evidence, Value and Risk
A long list of possible tests is not a strategy. Choose changes that answer important questions and can be evaluated responsibly. A practical priority record contains the observation, affected audience, proposed change, business outcome, effort and potential downside.
Start with verified faults that block a task, then consider stronger research-backed hypotheses. A clearly reproducible form error deserves a different treatment from a preference for a new button colour. A high-volume step may offer more learning opportunity, but a lower-volume step with high-value qualified buyers may still matter commercially.
Estimate value transparently. If only a small share of eligible visitors sees an element, an improvement there cannot be assumed to transform the whole site’s conversion rate. Account for the audience actually exposed, the plausible effect you want to detect and the downstream value of the action. Keep those assumptions visible rather than turning a priority score into a forecast.
Include risk in the decision. Changes involving pricing, consent, eligibility or sensitive information need appropriate review. Improving completion by hiding conditions, making cancellation difficult or pressuring visitors into an unsuitable purchase is not a sound optimization objective.
What CRO Is Not
CRO is not the same as a general website redesign. A redesign can improve a customer journey, but changing many things at once makes it harder to identify which element explains a later performance change. A controlled comparison of a full redesign can still evaluate that combined experience if the design and measurement support it.
CRO is also not simply copying a competitor. The competitor may serve a different audience, use a different offer or have an experience that performs poorly. Use observations to generate questions, then assess those questions against your visitors and business constraints.
SEO, advertising and CRO answer related but different questions. Search and advertising work can help bring relevant visitors; CRO examines the experience and outcomes after arrival. A conversion problem can also originate before the landing page if a campaign attracts the wrong audience or makes a promise the page cannot fulfil.
There is no requirement to postpone all traffic growth until every conversion issue is resolved. The right priority depends on the quality of the current traffic, the severity of the friction, the ability to fulfil demand and the available evidence. Scaling a broken process is risky, but testing a page with almost no relevant visitors may also be uninformative.
A Realistic Timeline for Seeing Results
There is no fixed number of weeks that makes every CRO test reliable. A technical fault may be verified and repaired quickly. A behavioural experiment needs enough eligible observations for its planned question, coverage of relevant business cycles and time for the outcome to mature.
Before starting, determine the baseline rate, the smallest change worth acting on, the test design and the available eligible traffic. The smaller the improvement you want to distinguish from normal variation, the more demanding the design can become. Multiple variants and delayed outcomes add further considerations. NIST’s proportion-testing guidance illustrates why the baseline, effect size, significance level and power affect sample planning. Its one-process calculation is not a two-version website-test calculator.
For scheduling arithmetic only, suppose a properly planned experiment required 2,000 eligible visitors per version and compared two versions. That would mean 4,000 visitors in total. At 200 eligible visitors per day, reaching that count would take about 20 days. The 2,000-per-version input is an illustrative assumption, not a sample-size recommendation or evidence that 20 days is sufficient for your site.
Account for weekly patterns, sales cycles, campaign changes and late-arriving outcomes. Do not quietly stop when a favourable number appears or extend a fixed-horizon test only because the first result was disappointing. Use the decision method specified by the design, including a valid sequential approach when one is deliberately chosen.
Statistical Significance and Uncertainty
A percentage can look large when the underlying counts are tiny. Version A producing one conversion from 50 visitors has a 2% observed rate. Version B producing two from 50 has a 4% observed rate. Calling that “double the conversions” describes those counts but does not establish a dependable uplift for future visitors.
Statistical testing assesses evidence under a specified model and design. It does not turn an observed result into a guarantee. Review the effect estimate, its uncertainty, the planned decision threshold and the practical value. A small effect may be detectable with enough data yet not justify the implementation cost.
Check the integrity of the experiment before interpreting the result. Were visitors assigned as planned? Did one version fail to load? Did tracking differ? Did the intended audience receive the experience? Unexpected differences in allocation or measurement can undermine the comparison even when a reporting tool displays a confident-looking result.
Repeatedly checking a conventional fixed-horizon test and stopping at the first favourable threshold can distort the error rate. A tool designed for valid sequential analysis may use different rules. Follow the method actually in use rather than applying a universal rule copied from another platform.
An inconclusive test does not prove that two experiences are equivalent. It may mean the data cannot distinguish a meaningful difference with the chosen design. State that limitation and decide whether more research, a different hypothesis or a larger feasible test would answer a useful question.
What to Do When Traffic Is Too Low for a Useful A/B Test
Low traffic does not make every improvement impossible. It changes what you can reasonably infer. Start with measurement verification, functional checks, accessibility issues and focused usability research. Correct clear defects and document what was changed without claiming an experimentally proven revenue uplift.
Reduce the question to the part of the journey with enough relevant activity, where that remains useful. Avoid splitting a small audience across many variants. Consider whether the outcome occurs frequently enough to evaluate, but do not substitute an easy-to-measure button click for qualified sales without explaining the gap.
A before-and-after review can provide operational context. Keep the same definitions, record other changes and report it as observational. It does not become a controlled test merely because the dates are similar. If a meaningful experiment would take longer than the offer or business conditions are likely to remain stable, choose a more suitable research method.
Why the Commercial Outcome Matters More Than a Percentage
At the same traffic volume, moving from a 2% conversion rate to 3% produces 50% more conversions. The increase is one percentage point and a 50% relative increase, not a 50-percentage-point increase. This arithmetic assumes the same conversion definition and comparable traffic.
To make the difference tangible, assume 2,000 eligible sessions in a month and one valid enquiry per converting session, with no duplicates. A 2% rate means 40 enquiries; a 3% rate means 60, or 20 additional enquiries. If those additional enquiries have a 25% close rate and each completed sale contributes C$400 after variable delivery costs, the potential contribution is 20 × 25% × C$400 = C$2,000.
Those inputs are hypothetical, and the calculation does not predict that a page change will achieve the higher rate. Deduct the cost of research, implementation, tools and additional handling where relevant. Check capacity and quality: if the extra enquiries are unsuitable or cannot be answered, their value is not established by the form total.
The same conversion count would result from 50% more eligible sessions at the original 2% rate, assuming the same visitor mix. That does not make optimization free or always preferable to acquiring traffic. Compare the incremental cost, evidence and likely constraints of each option.
Qualitative Research Alongside the Data
Short surveys, support questions and usability sessions can reveal concerns that event counts do not explain. Ask a focused question linked to a real decision. Feedback from a small group can suggest a problem worth checking, but it is not a representative estimate of how every visitor behaves.
Session recordings and similar tools need careful configuration and review. Masking should be checked rather than assumed to work. Exclude confidential areas and unnecessary personal information, limit access and retention, and assess the consent and privacy requirements that apply before deployment. A research tool does not remove the obligation to handle visitor information appropriately.
For example, if a usability check reveals that a displayed phone number cannot be activated on a mobile device, that is a reproducible interaction problem. Verify and fix it. This is a conditional example of what research can uncover, not a claim that a past client had that defect or achieved a particular result after repair.
How Ecommerce CRO Changes the Decision
For an online store, a completed order is only part of the outcome. A change that increases small, low-margin orders can raise the conversion rate while reducing contribution per visitor. Likewise, a promotion can move purchases forward without demonstrating a durable increase in demand.
Review product suitability, stock visibility, delivery information, payment errors and the clarity of the final total. Those are useful investigation areas, not a promise that one particular design will increase sales. Keep important costs and conditions visible rather than withholding them to make an earlier step look more successful.
Use a consistent treatment of returns and cancellations. If one version has had several weeks for returns to appear and the other has only a few days of orders, their net revenue is not yet comparable. Report an early order result separately from a mature financial result.
For an illustrative trade-off, suppose version A produces 40 orders with C$50 contribution per order, while version B produces 50 orders with C$35 contribution per order. Assuming comparable eligible traffic and fully matured costs, A contributes C$2,000 and B contributes C$1,750. B has more orders but C$250 less contribution. These invented inputs explain the decision; they are not a tested result.
Which Tools Does a CRO Process Actually Need?
Choose tools by the question rather than assembling the largest stack. Basic measurement, a dependable destination for enquiries or orders and a way to verify the customer task may be enough to begin. A testing platform cannot rescue an unclear objective or an unreliable event definition.
| Tool category | Useful question | Important limitation |
|---|---|---|
| Analytics and event validation | Where does the measured journey change? | Missing or duplicated events can misrepresent behaviour. |
| CRM, booking or order records | Did the action become a qualified or completed outcome? | Definitions, linking and delayed outcomes need attention. |
| Usability research and feedback | What difficulty or unanswered question can be observed? | A small or self-selected sample is not everyone. |
| Experiment assignment and analysis | How did a defined alternative compare under the planned design? | Traffic, randomization, measurement and statistical rules must support the conclusion. |
| Technical and accessibility checks | Can people complete the intended task reliably? | A technical result alone does not quantify a sales effect. |
Consider the total operating cost, implementation burden, data access and ability to export the results. Know who owns the configuration and can undo a failed release. Collect only information needed for the stated investigation, and review new tracking or recording requirements before adding a tool.
How to Read a Test Report Without Overclaiming
A usable result should answer the original question, not just announce a winner. Start with what was tested and who was eligible. Then read the dates, allocation, counts and event definitions. Check whether the report describes an experiment, a before-and-after observation or a planning estimate.
For example, an observed rise from 40 to 60 enquiries means little without the number and type of eligible visitors in each group. Even equal visitor counts do not settle the question if one group received a different offer, one event fired twice or qualification rules changed halfway through.
Look for both absolute and relative effects, uncertainty and the predefined decision rule. Review the guardrails and the maturity of downstream outcomes. A report that finds a positive initial signal but cannot yet assess sales should say so plainly. It should not turn that signal into annual revenue by multiplying an early week by 52.
End with a decision proportionate to the evidence: release and monitor, keep the current experience, investigate a fault, gather more relevant evidence or stop pursuing a weak hypothesis. Preserve the reasoning and implementation version so the next review starts from what was actually learned.
What to Require in a Useful Test Brief
A test brief should make the decision understandable before work starts. Begin with the observed evidence and its source: a reproducible error, a repeated usability difficulty, a customer question or a measured pattern. Keep the proposed explanation separate, because that is the part the test may challenge.
Name the eligible audience precisely. “Website visitors” may be too broad if the change appears only on one service page, one device layout or one campaign route. Explain who can see the experience, whether returning visitors keep the same assignment and which exclusions are justified. Avoid changing the audience after seeing which group looks better.
Describe the current experience and the proposed alternative in enough detail to verify both. State whether the test evaluates one element or a bundle. If the offer, page layout and form all change together, the conclusion must concern that combined experience rather than crediting one convenient part.
Define the primary outcome and the observation window. For a qualified-enquiry objective, identify who qualifies the lead and how long qualification usually takes. If that decision happens after the website session, explain how the outcome will be linked to the assigned experience. Do not silently replace an unavailable qualified-lead measure with a form-click total.
Specify the guardrails and what would trigger an early safety or functionality stop. A broken checkout, privacy exposure or serious accessibility regression is different from a disappointing early conversion rate. The test plan should not require leaving a harmful or unusable experience running merely to reach a sample target.
Record the analysis method, sample-planning assumptions and decision rule. Identify the person responsible for reviewing the result and the person who can release or revert the change. Include expected implementation and operating costs so a statistically detectable effect can also be assessed for practical value.
Finally, write down what an inconclusive result would mean for the business. It might justify retaining the current version, gathering better qualitative evidence or choosing a larger, more relevant change. Planning that outcome in advance reduces the temptation to reinterpret a weak result as success.
Check the Released Experience, Not Just the Mockup
Before collecting test data, complete the customer task in each experience. A visually correct mockup does not establish that the live form submits, the booking confirmation arrives or the payment flow works. Use appropriate test methods and exclude those test interactions from the business analysis.
Check relevant device sizes, input methods and common states such as validation errors, empty fields and successful completion. Verify that the alternative does not hide essential information, obstruct keyboard navigation or make the page harder to use. The goal is a fair comparison between functioning experiences, not an accidental test of which version contains a defect.
Confirm that the intended content actually appears to eligible visitors and that measurement identifies the correct version. Caching, delayed scripts or conflicting experiments can make the delivered experience differ from the planned one. Record what was verified instead of assuming the testing tool handled every implementation detail.
During the run, monitor basic integrity separately from the outcome analysis. A sudden loss of events, a failed form delivery or an unexpected allocation pattern deserves investigation. Document any interruption and assess whether the data remain usable; do not combine broken and working periods without considering the effect.
After a decision to release, test the permanent version again. Removing the experiment can change how the page loads or how events are recorded. Keep a rollback path and check downstream records as outcomes mature. A dashboard winner is not the end of implementation responsibility.
Evaluate the Cost of the Change, Not Just Its Lift
The financial decision concerns incremental value compared with the relevant alternative. Revenue attributed to a page is not necessarily revenue created by its latest edit. Existing customers and enquiries that would have converted anyway belong in the baseline, not automatically in the claimed return.

For a planning example, assume a change costs C$2,400 to investigate and implement and would produce C$600 in additional monthly contribution if the effect persisted. Simple payback would be four months before recurring costs. That calculation does not establish that the C$600 effect exists or will continue; it identifies the assumption the evidence must support.
If the change also adds C$100 in monthly software or handling costs, the assumed net monthly benefit becomes C$500 and simple payback becomes 4.8 months. This remains a simplified scenario. Capacity limits, seasonality, changing traffic and delayed refunds can alter the result. Do not annualize a short experiment without explaining why persistence is a reasonable assumption.
Compare the proposed investment with other feasible ways to address the same constraint. Fixing a measured intake delay may be more useful than another landing-page variant when suitable enquiries already arrive but are not answered. Conversely, a clear page failure may deserve attention before acquiring more traffic. The decision should follow the bottleneck and the evidence, not a rule that CRO always comes first.
Getting Started
Begin with one customer task and one reliable outcome. Check that the task works, reconcile the measurement, gather evidence about the friction and write a hypothesis the data could disprove. Choose an experiment only when it can answer that question responsibly.

For implementation help, reach out to Canada Create to discuss the available records and the scope of a conversion review. This guide explains the method; it does not promise that every website will benefit from the same change.
Canada Create is located at 126 Willowdale Ave., Suite #3, Toronto, ON M2N 4Y2. Call (416) 273-9030 to discuss a conversion audit with the team.
Frequently asked questions
What does CRO stand for in digital marketing?
CRO stands for conversion rate optimization. It means finding out why suitable visitors do not complete a useful action, such as a purchase, a qualified enquiry or a booking, then making a focused improvement and measuring the result. More clicks are not the aim if they do not lead to better customers. Sometimes the honest outcome of a test is that it proved nothing either way.
How is a website's conversion rate calculated?
Divide the eligible sessions that had at least one qualifying conversion by all eligible sessions, then multiply by 100. If 2,000 eligible sessions produced 50 valid enquiries, each in its own session, the rate is 2.5%. You can measure by users instead of sessions, but pick one unit and keep it. Counting every enquiry event is a different measure, since one person may submit twice.
Should I be happy with a 2.5% conversion rate on my site?
It depends on what the figure counts. In the post's example, 2,000 sessions give a 2.5% enquiry rate, but only 1.5% once you keep leads that meet the business's qualification rules. Both numbers are correct and answer different questions. Compare against your own baseline using the same definition, and check that attempted submissions are not being counted as received ones.
How does CRO differ from SEO?
SEO works on getting suitable visitors to your pages from search. CRO looks at what those visitors do once they arrive and whether they can complete the action you want. The two connect, because a page that ranks but confuses people wastes its traffic. Click-through rate measures clicks against impressions, while conversion rate measures a defined action against eligible sessions or users.
How do you improve a website's conversion rate step by step?
Verify that your conversion tracking counts real, completed actions once each. Map the route from arrival to the outcome and find the step where suitable visitors drop off. Write a testable hypothesis, make one focused change and measure it against a guardrail, such as lead quality. Fix a clear fault, like a phone number that cannot be tapped, straight away without testing it.
What is an example of conversion rate optimization in practice?
The post describes a hypothetical Toronto law firm whose mobile contact page gets visits, but nobody has checked whether the phone number can be tapped or whether calls reach the right person. The first job is to test that interaction and compare analytics with the actual intake records. If the link is broken, fix it and monitor results. A test only makes sense once the basic function works.
How do you do conversion rate optimization on a site with little traffic?
Low traffic often cannot support a reliable A/B test, so put more weight on fixing verified faults and on watching how real people use the site. Usability sessions and customer feedback can reveal difficulties that analytics only hint at. Record each change in a log and monitor the outcomes. Remember that a simple before-and-after comparison cannot isolate a change's effect on revenue.
Which conversion rate should an online store focus on?
Completed orders or net revenue per eligible visitor usually make the most useful primary measure for a store. Track average order value, contribution, cancellations, returns and checkout errors beside it. A bigger discount may lift orders while cutting the margin on each one. Agree these trade-offs before you look at a test result.