
Cost per Qualified Lead: Work Out What You Can Afford
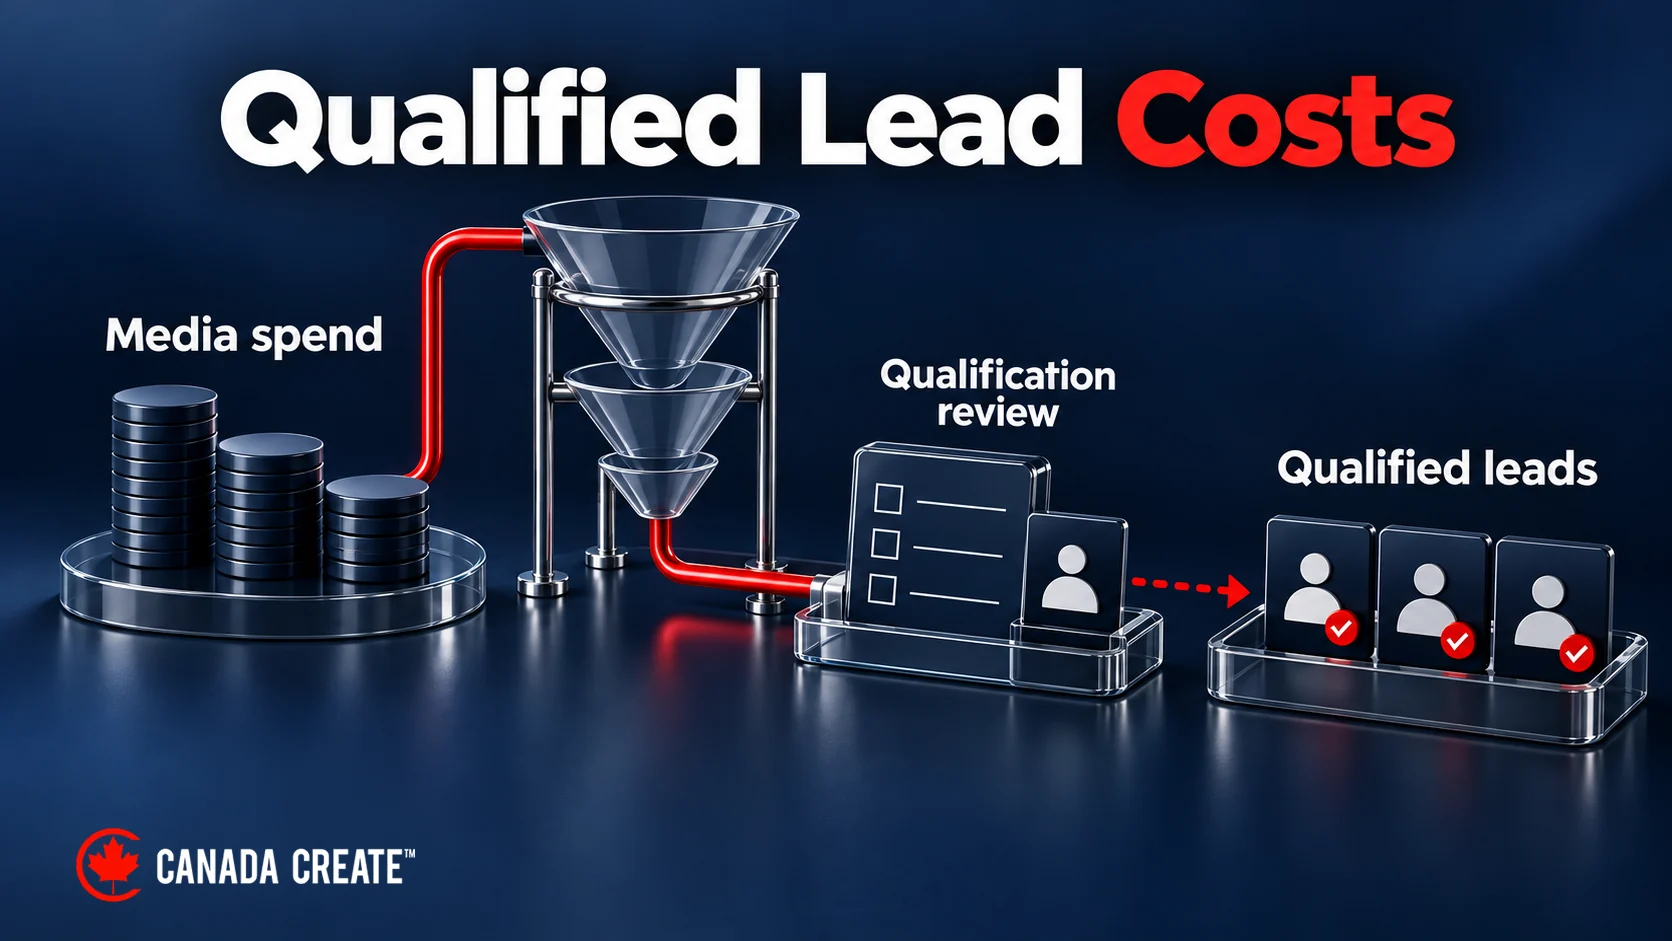
Cost per qualified lead is the acquisition cost divided by the number of leads that meet your agreed requirements. If you spend $6,000 on advertising and receive 60 qualified leads, your media cost per qualified lead is $100.
Whether that is affordable depends on what happens next: how many qualified leads become customers, what their work contributes after delivery costs, and how much the business needs to retain after acquisition.
Download the qualified-lead calculator to work through those numbers. It includes an actual-cohort calculation, a customer-target plan, scenarios and a cash schedule. The supplied figures are fictional Canadian dollars, not client results or industry benchmarks.
The workbook has prior LibreOffice calculation checks. Desktop Excel interface testing has not been established. Save a clean copy before editing: its formula cells are not locked. Start with Actuals B2:B10 and replace the sample figures with one matched group of enquiries and costs.
See what changes between an enquiry and a customer
Consider a fictional service business with $6,000 in advertising spend and $3,000 in other acquisition costs. It receives 120 genuine, unique new-customer enquiries. Sixty meet its qualification requirements, and 15 become customers by completing a first billable service.
| Measure | Calculation | Result |
|---|---|---|
| Media cost per enquiry | $6,000 ÷ 120 enquiries | $50 |
| Media cost per qualified lead | $6,000 ÷ 60 qualified leads | $100 |
| Total acquisition cost per qualified lead | $9,000 ÷ 60 qualified leads | $150 |
| Total customer acquisition cost | $9,000 ÷ 15 customers | $600 |
We build and run Google Ads campaigns measured on calls, forms and booked jobs, not clicks.
The campaign has a 50% qualification rate and a 25% qualified-lead-to-customer close rate. Those rates explain how a $50 enquiry becomes a $600 acquired customer once unsuccessful enquiries, lost opportunities and other acquisition costs are included.
The different amounts are not competing versions of the same metric. Each has a different denominator or cost scope. Put the label beside the figure when reporting it: media CPQL, total acquisition CPQL or customer acquisition cost.

For this business, the next question is whether a $600 acquired customer leaves enough contribution. A customer who buys $3,000 of work may look valuable, but much of that revenue could be needed for materials, labour and other delivery costs.
The affordable lead price comes from the completed work
The 15 fictional customers produce $45,000 of revenue before refunds. After $2,250 in refunds and credits, the business retains $42,750. Variable delivery costs total $24,750, leaving $18,000 before acquisition.
That is $1,200 contribution per customer: $18,000 divided by 15. Suppose the owner wants to retain $500 of that contribution per customer after acquisition to help cover overhead, profit objectives and uncertainty. This is an example planning choice, not a recommended amount.
The resulting total acquisition allowance is $700 per customer. At a 25% close rate, each qualified lead supports an expected acquisition allowance of $175: one-quarter of $700. Other acquisition costs use $50 per qualified lead, leaving $125 for media per qualified lead.
The observed $100 media CPQL is below that $125 modelled ceiling. Across the 60 qualified leads, the difference is $1,500. That amount is the headroom above the owner’s retained-contribution requirement under these particular assumptions.
The ceiling is not a recommendation to increase spending. It shows what the present economics can support if the close rate, customer contribution and other acquisition costs remain as assumed.

The same enquiry count can hide a much weaker result
Now consider a planning comparison using an $8,000 media budget. In the base case, media CPQL remains $100, half the enquiries qualify and one-quarter of qualified leads become customers.
In a downside scenario, media CPQL rises to $125, qualification falls to 40%, close rate falls to 20%, non-media acquisition cost rises to $60 per qualified lead, and contribution before acquisition falls to $1,000 per customer.
| Expected result at $8,000 media spend | Base case | Downside case |
|---|---|---|
| Qualified leads | 80 | 64 |
| Enquiries | 160 | 160 |
| Customers | 20 | 12.8 |
| Total acquisition cost | $12,000 | $11,840 |
| Contribution after acquisition | $12,000 | $960 |
| Headroom after retaining $500 per customer | $2,000 | −$5,440 |
Both scenarios produce 160 expected enquiries. An enquiry-only report would miss most of the difference. The downside produces fewer qualified opportunities, closes a smaller share and earns less contribution from each customer.
The fractional 12.8 customers is a forecast expectation. Actual customer counts are whole people or accounts; the projection does not promise a specific number of completed services.

Under the downside assumptions, the media allowance is only $40 per qualified lead: 20% × ($1,000 − $500) − $60. Paying $125 would be far above the amount that preserves the stated retained contribution.
This scenario is a way to inspect risk, not a prediction that results will deteriorate. Its practical value is showing what needs to be true for the base budget to work. If the forecast depends on a close rate that has never been observed in a mature comparable group, that assumption deserves attention before a spending commitment.
Decide what makes a lead qualified
A qualified lead is a genuine enquiry that meets requirements relevant to the service you can provide. For a residential contractor, those might include the requested service, service area, decision-making process and a feasible project window.
The definition should be clear enough for two people to review the same enquiry and usually reach the same decision. “Looks promising” is hard to compare across salespeople or months. “Requested an offered service for a property inside the service area, with a project the team can assess” gives the denominator a more stable meaning.
Keep the qualification decision separate from the final sales outcome. An appropriate prospect who chooses another provider remains a qualified lead that did not become a customer. Removing lost opportunities after the fact inflates the close rate and makes the affordable lead price look higher.
Likewise, do not loosen the definition simply to lower reported CPQL. If previously unqualified contacts are relabelled as qualified, the denominator increases and the ratio falls without the business obtaining any more suitable work.
Qualification can legitimately change as the business changes. A company expanding its service area or adding a service may accept enquiries it previously declined. Record when the new definition took effect, and avoid treating before-and-after ratios as directly comparable without acknowledging it.
Count people or opportunities consistently
In this model, an enquiry is a unique prospective new customer making a service request. One homeowner calling twice and submitting a form about the same project is one enquiry, not three.
A customer buying several services is still one acquired customer. Their relevant revenue and delivery costs belong to that customer. If your business budgets by project instead, use opportunities and acquired jobs throughout the calculation. Mixing a customer denominator with a project close rate can produce an attractive but meaningless result.
Exclude confirmed spam, supplier pitches and unrelated contacts from genuine enquiries, while retaining real requests that fail qualification. The acquisition spending that attracted unsuccessful contacts stays in the cost numerator. Removing those contacts from the lead count does not make their advertising cost disappear.
Keep raw call and form events in the operational records for reconciliation. They help explain why an advertising system shows more contact activity than the worksheet shows unique prospects. The financial model begins after those events have been connected to the people or opportunities they represent.
Platform conversion labels need a business definition
Google Ads distinguishes qualified leads and converted leads. Qualified leads have been further assessed outside the advertising platform; converted leads have reached a chosen later step. That later step depends on the advertiser’s process and does not necessarily mean cash has been collected.
A form event alone does not establish qualification. Google Analytics also lets businesses designate important actions as key events. You still need to specify which event represents a genuine enquiry and how later qualification is established.
For this guide’s example, the customer milestone is the first completed billable service. A signed proposal, booking, deposit and completed service could each be useful milestones, but they should not be silently substituted for one another in the acquisition calculation.
Include the cost of getting to the right leads
For media CPQL, use the advertising cost associated with the qualified-lead population. For total acquisition CPQL, add the other costs included in acquiring that same population.
That distinction lets the marketing team examine media efficiency while the business sees the wider cost of turning interest into work. A platform report generally cannot tell you the full cost of estimating, following up or managing the campaign.
Media spending
Use delivered advertising cost, adjusted for genuine media credits or refunds under your reporting policy. Keep it distinct from the budget you planned and the amount that happened to leave the bank during the period.
An invoice can arrive after the advertising ran. A prepaid balance can be used across periods. Reconcile the relevant media expense to the campaign and the enquiries being followed rather than using the nearest cash payment as a convenient substitute.
Use one currency throughout. If a supplier bills in US dollars and your service revenue is in Canadian dollars, translate the source amounts consistently before calculation. A dollar symbol does not establish that two amounts share the same unit.
Other acquisition costs
Possible costs include campaign management, acquisition-specific creative, landing-page work, relevant tools and the sales effort required to respond to and qualify enquiries. Include the effort spent on unsuccessful opportunities as well as successful ones.
For internal work, an agreed cost for time can make the resource requirement visible. An owner preparing estimates has used capacity even if no additional wage payment appears. Keep a non-cash allowance distinct from cash expenses so it does not accidentally become a payment in the cash schedule.
Shared work needs a reasonable allocation. Recorded hours may help divide sales or management effort. A shared software fee might be assigned across the activities it supports. Avoid charging the entire cost to each channel and then adding those channels together.
A one-time setup cost also needs a stated treatment. Charging it to a launch cohort may suit a launch decision. Spreading it over a defined useful period may suit a recurring comparison. Neither approach changes when the supplier must be paid, and changing the allocation method can alter CPQL without changing campaign performance.
Delivery costs belong in customer contribution
The cost of supplying the sold service reduces the amount available for acquisition. Depending on the work, that may include materials, subcontractors, variable technician hours, processing fees and rework.
Put each expense in one category. A commission already included in acquisition cost should not also reduce service contribution. A fulfilment cost included in the margin estimate should not be deducted again elsewhere.
Cost behaviour can change with volume. Existing staff may have capacity for a few more services, while a larger plan requires overtime or another hire. The contribution estimate used to assess additional leads needs to reflect the work the business would actually have to deliver.
The example excludes sales tax from revenue. Use a consistent treatment for recoverable and non-recoverable taxes in costs, agreed with the person responsible for your books. Keep the actual timing of tax payments and receipts in the separate cash view.
Calculate the lead-cost ceiling in plain dollars
There are four inputs to the media CPQL allowance:
- Contribution per acquired customer before acquisition.
- Contribution the business wants to retain per customer after acquisition.
- Qualified-lead-to-customer close rate.
- Other acquisition cost per qualified lead.
The formula is:
Maximum media CPQL = close rate × (contribution per customer − retained requirement per customer) − other acquisition cost per qualified lead.
For the example: 25% × ($1,200 − $500) − $50 = $125.
The order explains the logic. First decide what a customer can contribute towards acquisition after preserving the desired amount. Then allow for the fact that only a share of qualified leads become customers. Finally subtract the acquisition costs that must be paid outside the media budget.
Calling the result a ceiling keeps its meaning clear. If you can acquire comparable qualified leads at $100, a $125 allowance does not create a reason to pay more for them. Nor does a favourable average guarantee that the next group will have the same economics.
Separate break-even from the amount you want to retain
If the retained requirement is set to zero, the example’s allowance becomes 25% × $1,200 − $50 = $250 media CPQL. That is the point where the model leaves no contribution after acquisition.
It still leaves fixed overhead and other excluded company expenses to be covered. Calling $250 affordable without stating that limit would hide the owner’s real requirement. The $125 ceiling answers the more demanding question in this example because it preserves $500 per acquired customer.
The retained amount is a management assumption. It is not an automatic calculation of company overhead or a guarantee of profit. If that assumption is too low for the business, a plan can meet the worksheet threshold and still fail to cover the wider operation.
A zero or negative calculated media allowance is informative. It means the assumed contribution, close rate and non-media costs do not support positive media spending while retaining the requested amount. Preserve that result and examine the assumptions; do not replace it with a reassuring zero.
Ask what close rate the current price requires
You can also read the same equation backwards. At $100 media CPQL and $50 other acquisition cost per qualified lead, the business spends $150 for each qualified opportunity. It has a $700 acquisition allowance per acquired customer after preserving the example’s $500 requirement.
The required close rate is therefore $150 divided by $700, or approximately 21.43%. Above that rate, the stated economics leave the required contribution; below it, they do not, assuming contribution and acquisition costs otherwise remain unchanged.
This can turn a vague discussion about lead quality into a specific question: does a mature, comparable group support a close rate above the required level? The example’s observed 25% is above it, but a small group or many unresolved opportunities may leave considerable uncertainty.
Do not treat the threshold as a sales quota that the spreadsheet has proven achievable. It is a consequence of the price and customer economics entered. If a team needs to close an implausibly high share to make the lead price work, the useful response is to reconsider the price, service economics or acquisition approach. Changing the assumed rate alone does not change what customers will do.
Translate the ceiling back to enquiries only when useful
At a 50% qualification rate, the $125 media CPQL ceiling corresponds to $62.50 per enquiry. Half the enquiries are expected to qualify, so each enquiry supports half the qualified-lead allowance.
That translation relies on the qualification definition and rate staying the same. If the business starts receiving more unsuitable enquiries, its acceptable cost per enquiry changes even if the economics of a genuinely qualified opportunity remain unchanged.
This is why a vendor quote or channel report expressed as cost per enquiry needs an additional qualification assumption before comparison. The cheaper enquiry can become the more expensive qualified opportunity.
What to investigate when CPQL rises
A rising ratio can come from a higher cost numerator, a smaller qualified-lead denominator or both. Start with those amounts rather than choosing a campaign fix from the percentage alone.
If spending rises while qualified leads remain steady, review the additional costs and where the media was delivered. If genuine enquiries remain steady but fewer qualify, inspect the reasons for disqualification. The issue may involve the requested service, geography, timing or a changed qualification policy.
If qualified leads remain steady but fewer customers complete the service, CPQL may not change at all. Customer acquisition cost and contribution can still deteriorate. That is why the close rate belongs beside CPQL in a budget discussion.
Check whether the data changed before the business did
A form-tracking change can produce more contact events without producing more people. A missed source field can shift enquiries into an unknown channel. A delayed sales update can make a recent cohort appear to close poorly.
Trace a small set of enquiries from contact to qualification to the chosen customer milestone. Confirm that duplicate contacts are joined, stage dates make sense and completed work has a recorded outcome. This is a targeted way to understand an unexpected change before altering spending.
A falling qualified-lead count can also reflect more consistent qualification. If the team finally stops classifying out-of-area requests as qualified, measured CPQL rises while the business gains a more honest picture. Explain the measurement change rather than treating it automatically as a campaign decline.
Keep the next action tied to the reason. Missing outcomes require an update from the person who can verify them. A new concentration of unsuitable services requires a review of the acquisition message and audience. A lower service contribution requires a costing review. The ratio identifies where to look; it does not establish the cause on its own.
Keep a completed customer’s later refund in the economics
Under this workbook’s definition, a customer becomes acquired when the first billable service is completed. If that customer later receives a refund, retain the customer in the count and reduce revenue by the appropriate adjustment. The business still incurred the acquisition effort and supplied the service.
A cancellation before that completed-service milestone has a different treatment: it does not count as an acquired customer here. Any non-recoverable preparation or cancellation cost still belongs in the cohort’s economics. Removing the customer outcome should not also erase costs already incurred.
This convention makes the close rate and contribution describe separate things. The close rate records how many qualified leads reached the chosen milestone. Contribution records the economic result, including refunds and costs. Redefining refunded customers out of the count while leaving their costs scattered elsewhere can make both measures harder to interpret.
When comparing reports, check whether they use completed services, bookings or retained paying customers. Any of those can answer a useful question, but they need matching revenue, costs and labels. Apply the chosen policy consistently rather than changing the denominator after seeing which version looks strongest.
Give qualified leads enough time to become customers
Follow one acquisition group through its outcomes. This might be the genuine enquiries created in a month, with the spending that generated them assigned on a reasonable basis. Keep that group intact as qualification and customer outcomes develop.
Do not divide June advertising expense by every customer who paid during June and call it the final acquisition cost of June’s enquiries. Some payments may come from much older enquiries; some June enquiries may not buy until later.
In the fictional actual cohort, imagine six customers have completed their first service at an early review. With $9,000 total acquisition cost, the observed customer acquisition cost is $1,500. Later, when 15 have completed, it becomes $600. The original spending has not changed; more outcomes are known.
The early result should say “six customers to date” and identify open opportunities. Otherwise a reasonable delay can look like poor final economics. At the same time, do not assume all open opportunities will become customers simply because they remain open.
Use the full qualified-lead denominator
For the cohort’s close rate, divide customers to date by all its qualified leads. Calculating only among opportunities already resolved can create a different picture if quick wins, quick losses and slower decisions behave differently.
A resolved-opportunity rate can be useful operationally, but label it separately. It should not silently replace the qualified-lead-to-customer assumption used in the affordability model.
Choose an observation horizon using the actual sales and delivery process. Emergency repairs and commercial projects need different amounts of time. Look at older comparable groups to see when most qualifications, completions and final costs become known.
A mature result can still change because of later refunds or cost corrections. Keep its observation date and explain revisions. Maturity means enough development for the decision being made, not immunity from every future adjustment.
Match platform dates with your enquiry records
Google’s conversion reporting documentation distinguishes click-date reporting from conversion-time columns. The same calendar selection can therefore refer to different activity in an advertising export and a customer system.
A conversion window is another separate concept: it determines how long after an interaction a conversion can be recorded for that conversion action. Your business may need to follow service economics beyond the platform’s window.
Use the linked records and a declared reporting basis where available. If attribution or timing cannot be fully reconciled, keep that limitation visible. Do not force a channel’s spending to match every new customer in the business simply because a more precise split is unavailable.
Turn a customer target into a qualified-lead plan
Once the costs and rates are understood, the Planning sheet can work backwards from the customers the business hopes to serve.
For a target of 20 additional customers and a 25% close rate, the plan needs 80 qualified leads. With a 50% qualification rate, that implies 160 enquiries. At $100 media CPQL, the media budget is $8,000.
The example’s $50 other acquisition cost per qualified lead adds $4,000, producing $12,000 total acquisition cost. Twenty customers contributing $1,200 each would produce $24,000 before acquisition and leave $12,000 afterwards.
Retaining $500 per customer requires $10,000. That leaves $2,000 of modelled headroom, consistent with the base scenario shown earlier. The maximum media allowance for this plan is $10,000, but its expected media requirement remains $8,000.
Forecasts describe expected activity. Round required qualified-lead and enquiry counts upwards when preparing an operational requirement, then recalculate costs from the rounded counts. Preserve full conversion-rate precision inside the calculation. Rounding a close rate before division can materially change a small plan.
A lower volume can make each lead more expensive to handle
The $50 non-media allowance is an average at the example volume. A fixed monthly fee does not necessarily fall when fewer leads arrive.
Suppose acquisition support consists of a $2,500 fixed cost plus $18.75 per qualified lead. At 80 qualified leads, other acquisition cost is $4,000, matching the earlier example. At 40 qualified leads, it is $3,250, or $81.25 per qualified lead.
A plan that halves lead volume but automatically halves the fixed fee would overstate the money left. Use the Planning sheet’s Fixed + variable option when that cost pattern fits. Its fixed and variable inputs replace the simple per-lead model; they are not additional fees to stack on top of it.
This is also why historical total CPQL should not be treated as the exact cost of the next lead. Some costs are already committed, others change with workload, and some increase only when a capacity threshold is crossed.
Check the work your team can actually take on
The example’s base plan expects 20 customers, but the supplied workbook has only 16 additional customer slots. That is why its capacity result asks for review despite the positive contribution forecast.
If the business can complete only 16 additional first services in the relevant window, the same proportional assumptions imply 64 qualified leads and 128 enquiries. Media spending becomes $6,400 and other acquisition cost $3,200.
Those 16 customers would contribute $19,200 before acquisition, leaving $9,600 afterwards. The retained requirement totals $8,000, leaving $1,600 of headroom. This smaller scenario fits the stated customer-slot assumption, although actual outcomes can still vary.
The arithmetic assumes proportional acquisition costs. If support fees remain fixed, or the additional work requires overtime, use the appropriate cost model instead. A capacity number should not make the cost consequences disappear.
Check intake capacity as well as delivery
An estimator may struggle to assess 160 enquiries even when the delivery team could handle the eventual jobs. A backlog can change follow-up, customer experience and the observed close rate. The plan depends on the capacity to move enquiries through the process as well as to deliver sold work.
Delivery slots must account for existing commitments, expected repeat work and other sources of customers. Assigning the same available slot to advertising and referrals overstates the work the business can accept.
For mixed services, hours or another limiting resource may be more useful than customer count. A brief repair and a multi-day installation should not consume identical capacity in the plan. Estimate the service mix and identify the scarce technician, equipment or approval step.
Do not schedule every available slot against an expected customer count as if the forecast were certain. Better-than-expected conversion or longer jobs can create pressure too. The appropriate operating buffer depends on the business and its ability to reschedule or add capacity.
Use the cash schedule before committing the budget
A positive contribution forecast can coexist with a cash shortfall. Advertising and mobilization costs may be due before customers pay.
The workbook’s fictional cash example starts with $18,000 available. It then pays $8,000 for media, $4,000 for other acquisition costs and $10,000 for mobilization before any customer receipts. The $22,000 outflow creates a $4,000 shortfall.
The example deliberately leaves actual dates blank. Replace it with the dates and payment amounts for your plan, including deposits, progress payments, wages, suppliers, refunds and applicable tax cash flows. Put entries in payment order so the running balance reflects the timing.

Keep non-cash allowances, such as an owner’s opportunity-cost allocation, out of the cash outflows. Conversely, do not omit a real payment because its accounting expense is allocated to a different period.
A customer deposit belongs in the schedule only when the terms and collection assumption support it. Expected revenue is not automatically collected cash. If a shortfall appears, the plan needs a timing, scale or funding decision before the spending can be treated as feasible.
For recurring services, future customer contribution may improve longer-term economics while doing little to fund this month’s bills. If repeat value matters, use the customer lifetime value calculator with a defined horizon and serving costs. Keep that forecast separate from completed first-service contribution.
Read the workbook: a check is not an approval
Actuals B2:B10 contains the numerical inputs used in the first example: enquiries, qualified leads, customers, media cost, other acquisition cost, revenue, refunds, delivery costs and the retained requirement. Complete the cohort and review information below the results as well.
The calculation expects actual counts to be whole numbers with enquiries at least as large as qualified leads and qualified leads at least as large as acquired customers. A customer count exceeding qualified leads usually points to mismatched populations, an inconsistent qualification rule or a stage update problem that needs review.
The input status checks the numbers. It does not establish that all source records are present or that the cohort is mature. Formula cells remain editable, so keep a clean copy and avoid pasting over results. Reproduce the main calculation manually if a result changes unexpectedly.
Understand zeros and undefined results
With no qualified leads, CPQL cannot be calculated. Showing $0 would imply free qualified leads when there were none. Keep the spending visible and describe the ratio as unavailable.
With qualified leads but no customers yet, the observed close rate is zero. Customer acquisition cost remains undefined because it divides by the number of customers. Those are different outcomes and should be displayed differently.
If media spend is genuinely zero and qualified leads are positive, media CPQL can be zero for that scope. Total acquisition CPQL may still include staff, tools or other work. That result is not automatically a usable assumption for a future paid campaign.
Negative contribution and negative headroom are valid calculated results. Preserve them. The purpose of the model is to reveal when the assumptions fail to support the plan, including when the inputs look individually plausible.
Use each sheet for its own question
Actuals describes the observed cohort. Planning works backwards from a customer target. Scenarios compares the supplied Base, Downside and Capacity 16 cases using its selector. Cash schedule checks the timing of money available and payments. Instructions explains the conventions, while Assumptions log provides room to record material changes.
Keep observed history intact when exploring a proposed budget. If you change the close rate to see what would happen, make that change in the planning or scenario inputs rather than rewriting the actual customer count.
The workbook’s scenario selector uses one active set of assumptions. Inspect the selected case before copying a result into a presentation. A downside value separated from its assumption label can easily be mistaken for the current actual result.
Compare lead sources on the terms that matter
A lead source quoting a lower price may count a different event, include a different level of qualification or supply a different service mix. Before comparing prices, establish what the quoted lead means and what remains for your team to do.
If one source supplies raw enquiries and another supplies prospects who have already met your service and location requirements, their headline prices are not directly comparable. Estimate the qualification and closing steps still required, and include the associated handling costs.
Look at contribution per acquired customer as well. A source producing smaller jobs at a low CPQL might be useful if those jobs fit spare capacity and contribute adequately. Another might produce fewer, larger projects with a longer sales cycle. A fair comparison needs the same contribution horizon and an appropriate capacity view.
For a combined result, add costs and qualified leads before dividing. A simple average of channel CPQLs gives a small source the same weight as a large one. Keep channel-level differences available so the combined figure does not conceal a materially different service mix.
No universal CPQL benchmark can settle these choices. Your mature comparable cohorts, current delivery economics and the contribution the business needs to retain provide the more relevant starting point. External averages can be context only when their definitions and population are known.
Make the next decision specific
The fictional base case has a $100 media CPQL and a $125 modelled ceiling. The downside shows how the same enquiry volume can fail the retained-contribution requirement. The capacity and cash examples show why positive economics alone do not complete a spending decision.
For your own plan, put the observed CPQL, close rate, contribution per customer and non-media acquisition costs together. Then identify the particular assumption most likely to change the decision. Verify that assumption or reflect its uncertainty in the proposed commitment.
For wider campaign changes, the separate PPC ROI improvement guide covers the operational task. This calculation is complete when you can explain what a qualified lead costs, what a resulting customer contributes and why the proposed price leaves enough for the business under stated conditions.
Frequently asked questions
What is cost per qualified lead, and how do you calculate it?
Cost per qualified lead is the acquisition cost divided by the number of leads that meet the requirements you agreed in advance. If $6,000 of advertising produces 60 qualified leads, the media cost per qualified lead is $100. That figure alone does not tell you whether the price is affordable. You also need to know how many qualified leads become customers and what each customer contributes after delivery costs.
What does CPL mean, and why is cost per qualified lead usually higher?
CPL stands for cost per lead, which usually divides spend by every enquiry received. Cost per qualified lead divides the same spend only by the enquiries that meet your qualification rules, so it is higher whenever some enquiries fall short. In the guide's fictional example, $6,000 of media gives $50 per enquiry and $100 per qualified lead. Put the label beside each figure when you report it, since the two measure different things.
How much should a business be willing to pay for a qualified lead?
Work backwards from the completed work instead of picking a target price. Start with the contribution a customer leaves after refunds and delivery costs, subtract what you want to retain, multiply by your close rate and then deduct other acquisition costs per qualified lead. In the fictional example, $1,200 of contribution less a $500 retained amount leaves $700, a 25% close rate turns that into $175, and $50 of other costs leaves a $125 media ceiling. The ceiling shows what current economics can support, and it is not a reason to spend more.
Can an average cost per lead by industry serve as my own CPQL target?
An industry figure is a poor stand-in because it ignores your close rate, delivery costs and the margin you need to keep. Two businesses in the same trade can afford very different lead prices. The figures in the guide's workbook are fictional Canadian dollars, chosen to show the method, and they are not benchmarks. Use your own matched records of enquiries, qualified leads, customers and costs instead.
Which costs belong in a cost per qualified lead calculation?
For media CPQL, use the delivered advertising cost tied to the qualified leads you are counting, adjusted for genuine media credits. Total acquisition CPQL adds the other costs of reaching those same leads, such as campaign management, acquisition creative, landing-page work, relevant tools and sales effort. Reconcile media expense to the campaign itself instead of using whatever payment happened to leave the bank that month. Keep every amount in one currency before you divide.
How does cost per qualified lead compare with cost per acquisition?
Cost per acquisition divides total acquisition cost by customers won, while CPQL divides it by qualified leads. In the guide's example, $9,000 of total cost produces $150 per qualified lead and $600 per customer, because only 15 of the 60 qualified leads complete a first billable service. Neither number is wrong. They use different denominators, so name the one you are quoting.
What makes an enquiry count as a sales qualified lead?
A qualified lead is a genuine enquiry that meets requirements relevant to work you can actually deliver, such as the requested service, service area and a feasible project window. The rule should be clear enough that two people reviewing the same enquiry usually reach the same decision. Keep qualification separate from the sales outcome, so a suitable prospect who picks another provider still counts. If the definition changes, record the date it took effect.
Does Google Ads charge advertisers per qualified lead?
Your cost per qualified lead is something you calculate from spend and your own qualification records, and the advertising platform does not set it for you. Google Ads does let advertisers separate qualified leads from converted leads once those outcomes are assessed outside the platform. A form event on its own does not prove an enquiry was qualified. Decide which later milestone counts as a customer, such as a first completed billable service, and keep it consistent.
How can a business keep lead cost under control without bending the numbers?
Hold the qualification rule steady, because relabelling weak contacts as qualified lowers CPQL without bringing in any more suitable work. When the figure rises, first check whether tracking or definitions changed before assuming the business did. Exclude spam and supplier pitches from the lead count while leaving the spend that attracted them in the cost total. Give recent leads enough time to close before judging a campaign on its customer numbers.