
Nonprofit Marketing Statistics 2026: Canadian Giving and Online Fundraising

Nonprofit marketing statistics help charities and nonprofits in Canada plan where to put a small marketing budget: how much Canadians give, how online fundraising is changing, what email, ads, social media and websites return, and how AI search is affecting the traffic nonprofits rely on. This 2026 edition brings together Canadian giving data and the newest online fundraising benchmarks. Every figure names its original publisher and the year it describes, and the publishers are listed at the end so you can check the latest edition.
Key nonprofit marketing statistics at a glance
| Statistic | Figure | Published by |
|---|---|---|
| Charitable donations claimed by Canadian tax filers, 2023 | About $12.8 billion | Imagine Canada research note on Statistics Canada preliminary data (May 2025) |
| Share of Canadian tax filers claiming donations, 2023 | 16.8%, a new low | Imagine Canada (May 2025) |
| Share of all donations claimed by tax filers earning $1 million or more, 2023 | 21%, up from 15.7% in 2021 | Imagine Canada (May 2025) |
| Change in online revenue for the average nonprofit, 2025 | Up 15% | M+R Benchmarks 2026 |
| Share of online revenue from monthly giving, 2025 | 27% | M+R Benchmarks 2026 |
| Share of annual online revenue received in December | 37% | M+R Benchmarks 2026 |
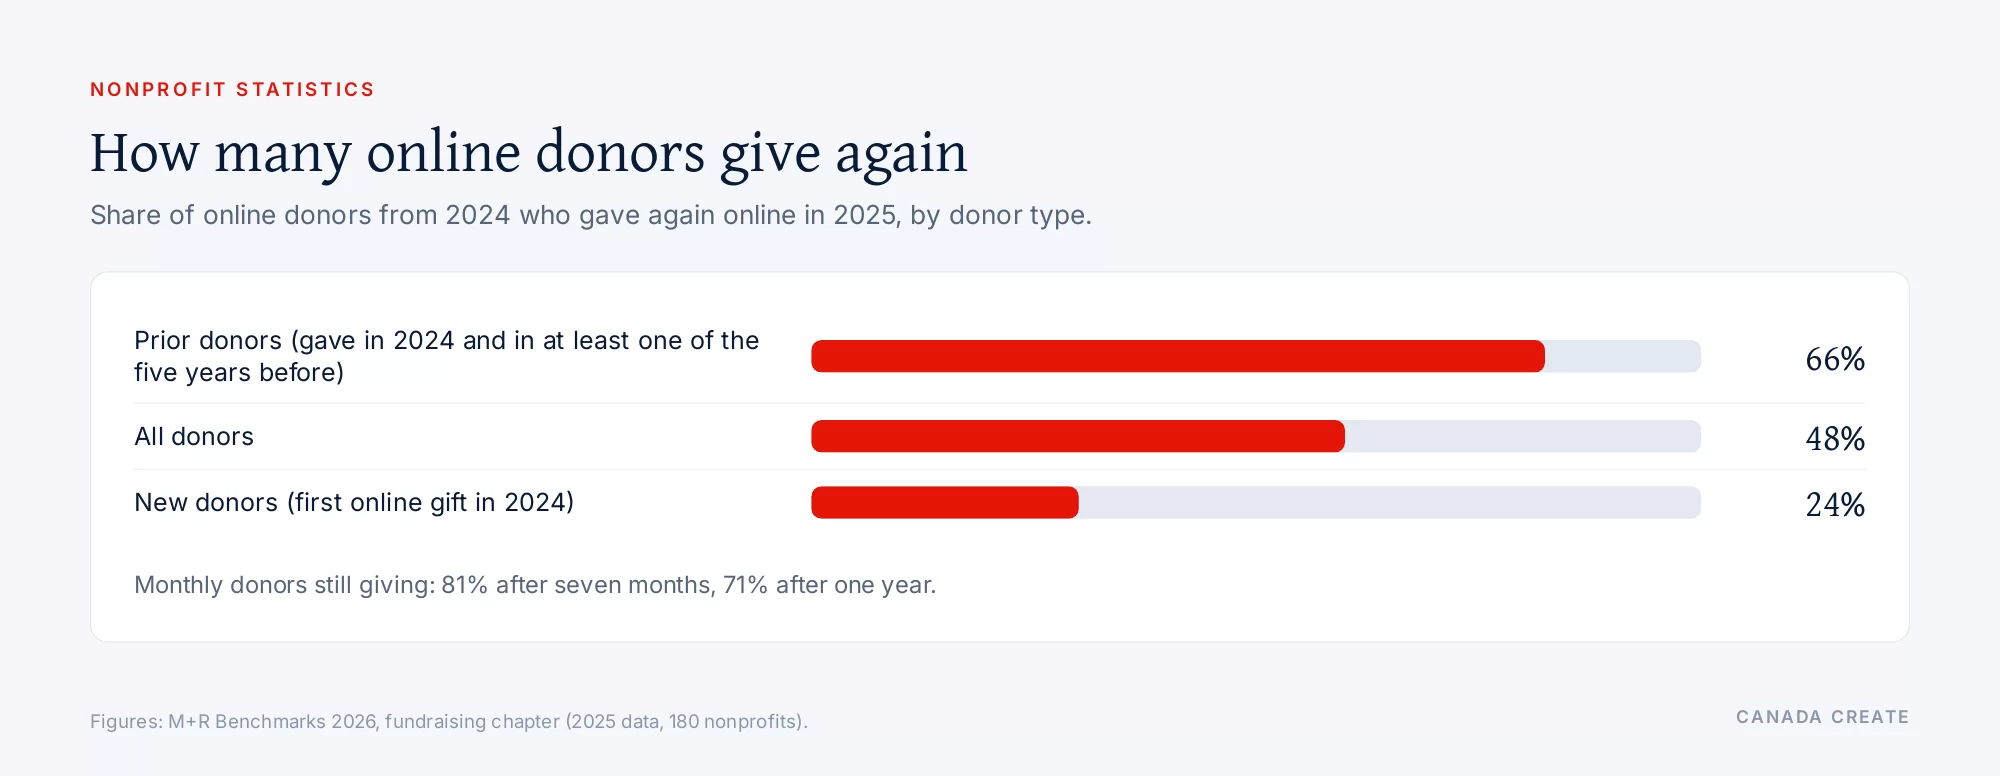
| Retention of new online donors | 24% (66% for prior donors) | M+R Benchmarks 2026 |
| Revenue per 1,000 fundraising emails sent | $54 | M+R Benchmarks 2026 |
| Digital ad spend reinvested per dollar raised online | $0.10 | M+R Benchmarks 2026 |
| Share of nonprofit website visits from organic search, 2025 | 39%, declining through the year | M+R Benchmarks 2026 |
| Google Ad Grants budget for a qualifying nonprofit | Up to US$10,000 a month in search ads | Google Ad Grants |
We plan and send nonprofit email campaigns that grow donations and engagement.
Charitable giving statistics in Canada
The most complete measure of individual giving in Canada comes from tax returns. Imagine Canada, the national charitable sector organization, reviewed Statistics Canada’s preliminary estimates for 2023 in a research note published in May 2025. Its findings:
- Canadian tax filers claimed about $12.8 billion in charitable donations in 2023, about $1.3 billion more than in 2022.
- Adjusted for inflation, donations grew by about 7.6%, or roughly $900 million, the second largest year over year increase on record.
- Giving was still about $320 million below the 2021 peak in constant dollars.
- The share of tax filers claiming donations fell to a new low of 16.8%, even though about 95,000 more people donated, because the number of tax filers grew by just over a million.
- The average donation rose 5.6% in real terms, while the median donation fell slightly.
How much Canadian giving depends on large donors
Imagine Canada found that giving is increasingly concentrated. In 2023, 73% of tax filers with incomes of $1 million or more donated, giving an average of $144,857 each. Together these donors accounted for 21% of all donations, up from 16.5% in 2022 and 15.7% in 2021. Average donations fell for almost every income group below $500,000.
Tax data understate total giving, since not every gift is receipted or claimed and spouses can combine their claims. Still, the direction is clear: fewer Canadians give, and those who do give more. For a nonprofit’s marketing, that means two jobs at once: widening the base of small and monthly donors, and looking after the relationships that produce major gifts.
Online fundraising statistics
The M+R Benchmarks Study is the largest annual benchmark of nonprofit digital results. Its 2026 edition covers 2025 data from 180 participating nonprofits, including Canadian organizations such as the Canadian Red Cross, the Nature Conservancy of Canada, Greenpeace Canada, Special Olympics Canada and Wildlife Preservation Canada. M+R reports medians, so one exceptional program does not skew the averages.
- Online revenue for the average nonprofit rose 15% in 2025, after two relatively flat years. Every size group grew by at least 14%.
- Revenue from one-time gifts rose 17% and monthly giving revenue rose 12%.
- Monthly giving made up 27% of online revenue overall, 22% for small nonprofits (online revenue under $1 million) and 37% for the largest (over $10 million).
- Revenue from donor-advised funds rose 44%.
- Nonprofits received 37% of all 2025 online revenue in December, and the last day of the year alone brought in 4%.
Donor retention
Keeping donors is harder than finding them. In M+R’s data, new online donors accounted for 31% of online revenue in 2025, but only 24% of the previous year’s new donors gave again. Retention for prior donors was 66%, and overall retention was 48%. For monthly donors, 10% stopped within two months of signing up, 81% were still giving after seven months and 71% after a full year.
Nonprofit email marketing statistics
Email remains the workhorse of online fundraising. M+R found that in 2025:
- email revenue rose 16% on average, and email directly produced 11% of all online revenue
- nonprofits raised $54 for every 1,000 fundraising emails sent, up 4% from 2024
- revenue per email subscriber reached $2.40, up from $1.87 the previous year
- fundraising emails averaged a 0.59% click-through rate and a 0.05% response rate
- advocacy emails averaged a 2.3% click-through rate and a 1.4% response rate
- a subscriber received about 50 messages in the year, 31 of them fundraising appeals and 9 newsletters
- lists grew 5% net, after 4% of subscribers were lost to bounces and 12% to unsubscribes
In Canada, the anti-spam law (CASL) exempts messages sent by or for a registered charity when their primary purpose is raising funds. Nonprofits that are not registered charities, and charity messages that sell something, follow the normal consent rules. Clear sender identification and a working unsubscribe link are good practice on every list. Our nonprofit email marketing team builds and runs donor email programs for Canadian charities.
Text messaging statistics for nonprofits
- Mobile messages produced 0.9% of online revenue in 2025, but mobile revenue grew 48%.
- Nonprofits had 176 mobile subscribers for every 1,000 email subscribers.
- Mobile fundraising messages averaged a 3.7% click-through rate and a 0.17% response rate; advocacy messages averaged a 2.6% response rate.
- For small nonprofits, mobile brought in 20 cents per dollar of email revenue, against 9 cents overall.
Nonprofit digital advertising statistics
M+R participants increased digital ad spending by 18% in 2025 and reinvested $0.10 in digital ads for every dollar raised online.
- 58% of ad spend went to direct fundraising; for small organizations, brand awareness (37%) nearly matched fundraising (38%).
- Paid search returned $2.48 for every dollar spent, the strongest of the channels measured; multichannel formats such as Performance Max and Demand Gen returned $1.82, and nonprofits more than doubled their investment in them (up 131%).
- Display ads returned $1.11 and digital video $0.56; display and video spending fell 4% and 5%.
- The average cost per lead across digital advertising was $2.81; Meta reported $3.64 per lead, while display reached $86 and Snapchat $78.
Google Ad Grants statistics
Google Ad Grants gives each qualifying nonprofit access to up to US$10,000 a month in search ads on Google. M+R measured a return of $0.17 per grant dollar and 229 site visits for every $1,000 of grant spend, so grants work better for reach, volunteers and awareness than for direct donations, which paid search handles better. Google lists the Federation of Canadian Artists among its Ad Grants examples, with 70,000 new website visitors to its exhibitions. Our Google Ad Grants management service helps Canadian charities apply for and run the grant.
Nonprofit website and search statistics
- Organic search delivered 39% of nonprofit website visits in 2025, but its share fell month by month through the year, a decline M+R links to zero-click searches and AI answers.
- 1.6% of all website visitors made a donation, worth $1.33 per visitor.
- Mobile users were 52% of visits but 43% of donations and only 28% of revenue.
- The average desktop gift was $168 and the average mobile gift $88.
- On primary donation pages, 11% of desktop visitors and 8% of mobile visitors completed a gift; for small nonprofits on mobile it was 4%.
- 79% of nonprofits offered PayPal on donation pages, 58% Google Pay and 57% Apple Pay.
A falling share of search visits makes the donation page more important, not less. Fast pages, a short form, wallet payments on phones and clear answers to the questions donors type into Google and AI tools all count. The SEO for nonprofits and nonprofit website design services cover both sides.
Nonprofit social media statistics
- Almost every M+R participant was on Facebook and Instagram; 74% were on YouTube, 43% on TikTok, 37% on Bluesky and 32% on Threads.
- 54% used X (Twitter) in 2025, a marked drop from earlier years, and it was the only platform where nonprofits lost followers (down 3%).
- TikTok audiences grew fastest, up 37%.
- The average nonprofit had 53,000 Facebook followers, 18,000 on Instagram and 2,000 on YouTube.
- 58% worked with outside influencers at least once; every one of them used Instagram and 72% used TikTok.
Nonprofit marketing statistics by cause
Results vary widely by cause, which is why M+R reports each sector separately. A few contrasts from the 2026 study:
- Hunger and poverty nonprofits grew online revenue by an average of 37% in 2025, and 3.3% of their website visitors donated, worth $5.58 per visitor, against 1.6% and $1.33 across all sectors.
- Public media also grew online revenue by 37%; its email revenue rose 130% and it raised $309 per 1,000 fundraising emails, nearly six times the overall average.
- Wildlife and animal welfare groups sent the most email, about 108 messages per subscriber in the year, and drew 2.7% of revenue from mobile messages.
- Health nonprofits reported the highest cost per lead from digital ads, $9.25, against $2.81 overall.
- Environmental groups increased digital ad spending by 31% and reinvested $0.20 in ads per dollar raised online, double the study average.
- Among organizations that received government funding, two-thirds said they received less of it in 2025 than in 2024.
The lesson for a Canadian charity is to compare itself with organizations in the same cause and of a similar size before deciding whether a result is good. A food bank and a land trust can run equally strong programs and still produce very different numbers.
Nonprofit teams, agencies and AI
- Digital teams at small nonprofits had a median of 5 people; the largest had a median of 13.
- 75% of participants worked with an outside agency, including 62% of small nonprofits.
- 69% had some policy or guidelines in place for generative AI.
For a Canadian charity with a small team, these numbers support a focused plan: a strong donation page, a regular email program, a monthly giving offer, the Ad Grant used for reach and one or two social channels done well. Our nonprofit marketing page explains how we work with Canadian charities.
Common mistakes when reading nonprofit statistics
- Comparing editions of M+R Benchmarks. M+R asks readers not to compare one year’s report with another, because the participant pool and size groups change.
- Treating tax data as total giving. Tax filer data leave out gifts that were not receipted or claimed.
- Ignoring currency and country. Most M+R participants are US organizations, so dollar values reflect mainly US results; Canadian donation values can differ.
- Judging Ad Grants by revenue alone. Grant clicks are best measured by visits, sign-ups and volunteers.
- Looking at averages only. M+R’s ranges show half of results within the middle band; your own trend over time is the best benchmark.
What these numbers mean for Canadian nonprofits
Canadians gave about $12.8 billion through tax-receipted donations in 2023, but a shrinking share of people give and large donors carry more of the total. Online fundraising grew 15% in 2025, December remains decisive, monthly giving provides more than a quarter of online revenue and only one new donor in four gives again. Search traffic is falling as AI answers grow, which puts more weight on email, donation page conversion and clear, well-structured content.
References
- Imagine Canada, “A Tipping Balance? Update: Preliminary Data on 2023 Charitable Donations” (research note, May 2025): imaginecanada.ca
- M+R Benchmarks 2026, fundraising chapter: mrbenchmarks.com
- M+R Benchmarks 2026, email messaging chapter: mrbenchmarks.com
- M+R Benchmarks 2026, mobile messaging chapter: mrbenchmarks.com
- M+R Benchmarks 2026, advertising chapter: mrbenchmarks.com
- M+R Benchmarks 2026, website performance chapter: mrbenchmarks.com
- M+R Benchmarks 2026, social media and influencers chapter: mrbenchmarks.com
- M+R Benchmarks 2026, the big story and participant list: mrbenchmarks.com
- Google Ad Grants: google.com
Frequently asked questions
How much do Canadians donate to charity each year?
Imagine Canada's review of Statistics Canada's preliminary tax data found Canadian tax filers claimed about $12.8 billion in charitable donations in 2023, roughly $1.3 billion more than in 2022. Adjusted for inflation, giving grew about 7.6% but remained about $320 million below the 2021 peak.
What percentage of Canadians donate to charity?
The share of tax filers claiming donations fell to a new low of 16.8% in 2023, according to Imagine Canada. About 95,000 more people donated than in 2022, but the number of tax filers grew by just over a million. Tax data leave out unreceipted gifts, so the real share of givers is higher.
How much did online fundraising grow in 2025?
The M+R Benchmarks 2026 study found online revenue for the average nonprofit rose 15% in 2025, after two relatively flat years. One-time giving revenue rose 17% and monthly giving revenue rose 12%, and every size group grew by at least 14%.
How important is monthly giving for nonprofits?
Monthly giving produced 27% of online revenue in 2025 in M+R's study, 22% for small nonprofits and 37% for the largest. After a full year, 71% of monthly donors were still giving, which makes a monthly offer one of the strongest ways to steady income.
What is a good nonprofit email click-through rate?
M+R measured an average click-through rate of 0.59% and a response rate of 0.05% for fundraising emails in 2025, and 2.3% and 1.4% for advocacy emails. Nonprofits raised $54 for every 1,000 fundraising emails sent and $2.40 per subscriber over the year.
What is the donor retention rate for nonprofits?
In M+R's 2026 study, only 24% of new online donors gave again the following year, compared with 66% of prior donors, for an overall retention rate of 48%. Thank-you messages, a clear welcome series and a monthly giving offer all help move new donors into the second group.
How much of nonprofit giving happens in December?
Nonprofits received 37% of all 2025 online revenue in December, according to M+R, and the last day of the year alone produced 4% of annual online revenue. Year-end campaigns, tested donation pages and email schedules for the final week matter more than any other period.
How much is a Google Ad Grant worth?
Google Ad Grants gives each qualifying nonprofit access to up to US$10,000 a month in search ads on Google. M+R found grants produced 229 site visits for every $1,000 of grant spend, so they suit awareness, volunteer and sign-up goals better than direct donations.
How much traffic do nonprofit websites get from search?
Organic search delivered 39% of nonprofit website visits in 2025 in M+R's study, but its share declined month by month through the year as zero-click searches and AI answers grew. That makes donation page conversion and email more important for steady income.
Do donors give more on desktop or mobile?
In M+R's 2025 data, mobile users made up 52% of nonprofit website visits but only 28% of revenue. The average desktop gift was $168 and the average mobile gift $88, so a short, wallet-friendly mobile donation form is worth the effort. Our nonprofit marketing team builds those programs for Canadian charities.